Category Archives: SCOM 2012 R2

SCOM: OpsLogix VMware MP V1.3.2.10

OpsLogix, a company long involved in developing management packs to improve the functionality of SCOM, have released an update to their VMware management pack. It is already available if you have a valid support contract.

Version 1.3.2.10 contains following changes or additions:

  • The VMware modules have been optimized to take up less cpu/mem resources.
  • Previously, the performance collections for Virtual Machines were disabled by default. In this version you can enable it with an override.
  • Performance collections for Virtual Machines are set to 15min intervals
  • Performance monitoring for Virtual Machines and ESX Hosts are set to 5 min intervals
  • Added Virtual Machine Snapshot to count monitoring as running level and total count
  • Added property to see what snapshot is currently used for the Virtual Machine
  • Added the location path of the Host and Virtual Machine. For example: now you can see on which host a Virtual Machine is currently running.
  • Removed the overall status of a datacenter based on the VMware api. A rollup based on the availability status has been added.
  • Added availability, configuration, performance and security rollups for the datacenter.
  • Added VMware tools status monitoring.
  • Optimized the connections/session to the Vcenter or hosts to read out the monitoring data.
  • Updated the layout of the configuration dashboard.
  • Extra log features have been added to debug the management pack by using special registry keys.
  • The password is now always stored as FIPS. In environments without FIPS it will fall back to NON-FIPS.
  • Updated installation guide with new UI screenshots.

Loading

SCOM: SQL Dashboards workaround for slow performance

Microsoft has finally officially recommended a workaround that some of us have been using for some time to keep the SQL dashboards in a usable state.

Dashboards may work slowly if used rarely

Issue: When used rarely or after a long break, the dashboards may work rather slowly due to large amounts of the collected data to be processed; especially, it is related to large environments (2000+ objects).

Resolution: Below is a “warming up” script, which may be used to create an SQL job to run on some schedule. Before scheduling it as an SQL job, please test how long these queries will be executing (if you will schedule it to run too often or execution time is too long, that may kill the performance). If you have dashboards with thousands of objects to load, then time to load the content will be 10+ seconds anyway. It was tested with 600 000 objects, and the dashboard loading time was 1-2 minutes.

USE [OperationsManagerDW]

EXECUTE [sdk].[Microsoft_SQLServer_Visualization_Library_UpdateLastValues]

EXECUTE [sdk].[Microsoft_SQLServer_Visualization_Library_UpdateHierarchy]

It is also worth noting that the following versions of SQL Server Management Pack are considered as deprecated and suspended:

  • 1.314.35
  • 1.400.0
  • 3.173.0
  • 3.173.1
  • 4.0.0
  • 4.1.0
  • 5.1.0
  • 5.4.0
  • 6.0.0
  • 6.2.0
  • 6.3.0

Loading

SCOM: Updated SQL MPs for Dashboards, SSAS and SSRS version 6.6.7.6

Several SQL Management packs have been updated, version 6.6.7.6 for each of them can be found at the following locations:

As usual treat new management packs with caution, especially considering the recent issues with SQL and Base OS ones and test, test, test!

SQL Server 2014 Analysis Services – here
SQL Server 2012 Analysis Services – here
SQL Server 2008 Analysis Services – here

SQL Server 2014 Reporting Services (Native Mode) – here
SQL Server 2012 Reporting Services (Native Mode) – here
SQL Server 2008 Reporting Services (Native Mode) – here

Management Pack for SQL Server Dashboards – here


Updated in this version

Dashboards

  • Fixed “The client has been disconnected from the server. Please call ManagementGroup.Reconnect() to reestablish the connection” exception.
  • Replaced 999+ presentation with a new one (26.2k)
  • Added configurable rule to pre-aggregate data in the DW (see the corresponding Known Issue)
  • Added second row in the instance view to show Path of the object, and allow searching by Path.
  • Fixed tooltip presentation on the Instance view

“Known issues and Troubleshooting” section of the guide is updated

SQL Server Reporting Services

  • Fixed issue: Microsoft System Center Management Pack for SQL Server Reporting Services doesn’t discover SSRS instance when the instance name starts from some certain symbols (0-9, A-F)
  • Instance configuration monitor is introduced
  • Implemented a better logging system
  • Improved the Report Manager availability monitor: now it parses human readable message to get the real status of the Report Manager
  • Improved the Report Manager and Web Service availability monitors: now the user can treat some status codes as healthy via the override.
  • Fixed the discoveries, now the last items can be undiscovered
  • Added timeout support for every non-native workflow
  • Simplified the dashboard to make it quicker and more informative
  • Reviewed and updated the Knowledge Base articles
  • Improved Run As mappings
  • Updated the discoveries to throw errors in case of some problems detected during the discovery
  • Updated the references and removed deprecated elements to support 6.6.4.0+ visualization library
  • Changed the performance rules write actions accounts to “Default Action account”
  • “Known Issues and Release Notes” section of the guide is updated
  • Fixed “Memory consumed by other processes (%)” rule having no Run As profile for DS; added SQL MP default Run As to the data source
  • Fixed “Failing replacement: $Data/Context/Property[@Name='<MonitorName>’]$” issue in OM log

SQL Server Analysis Services

  • Updated references and removed deprecated elements to support 6.6.4.0+ visualization library
  • Fixed bug when SSAS Monitoring Pack could not collect OS performance counters with localized names
  • Updated discoveries to throw errors in case of some problems detected during the discovery
  • Fixed module error collection on cluster instances to reduce the noise
  • Changed defaults for CPU Usage monitor, added sampling to Memory Usage on the server monitor
  • Reduced inner complexity of modules
  • Fixed the discoveries; now the last items can be undiscovered
  • Simplified the dashboard to make it quicker and more informative
  • Reviewed and updated the Knowledge Bases
  • Added timeout support for every non-native workflow
  • Fixed Blocking Session Monitor – in some situations it could calculate blocking sessions incorrectly
  • Win10 support: fixed OS version detection issue
  • Fixed CPU usage alert description
  • “Known Issues and Troubleshooting” section of the guide  is updated


Loading

SCOM: Monitoring a Fortigate Firewall

A while ago I had a request from one of my clients to monitor their new Fortigate Firewalls, as there is no existing management pack for this it required a bit of custom work.

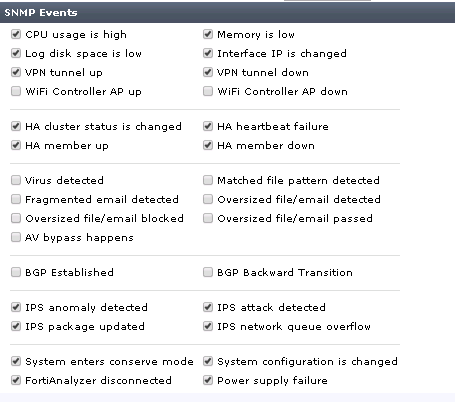
First on the firewall you’ll also need to configure SNMP, as well as what trap notifications will be sent.

snmptraps

Then discover the Fortigate using the standard network monitoring discovery.

This is the address for the Fortigate MIB file contents which you will need in order to map OIDs for the next part.

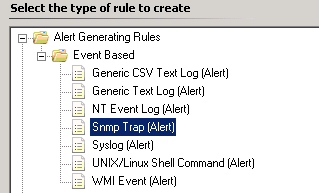
In SCOM create an SNMP Trap alerting Rule targeting the Node Class.

snmpalerting1snmpalerting2

For now leave the OID properties filter empty
snmpalerting3

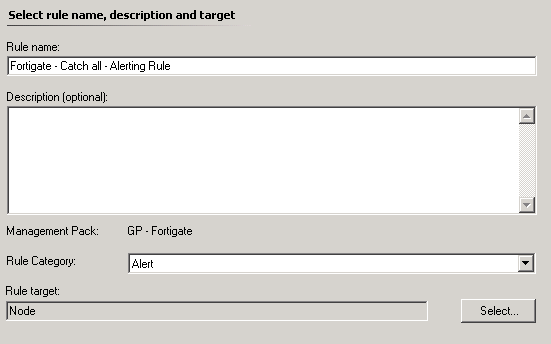
This rule will be used to identify any OIDs in the future that may be missing from your specific alerting rules.

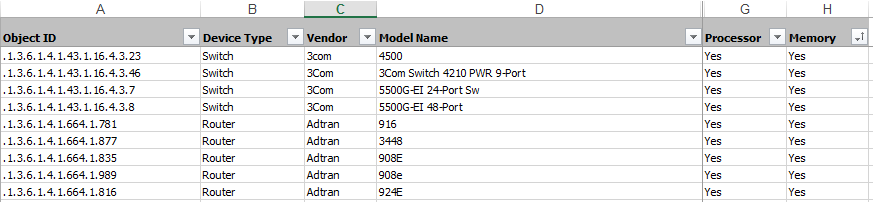
Now using the MIB list provided earlier each alert ticked in the Fortigate configuration needs to be mapped to the relevant OID and a specific alerting rule created for it, for example 1.3.6.1.4.1.12356.101.4.4.2.1.2 is the OID for HIgh Processor Usage. So in order to generate an alert for High CPU on the Fortigate you will need a rule with this specific OID in the filter 1.3.6.1.4.1.12356.101.4.4.2.1.2.

Repeat for each OID that you need to monitor and use the catch all to identify anything you may have missed.

Loading

SCOM: Management Pack for Windows 10 Operating System v10.0.0.0

A management pack for windows 10 OS has been release, v10.0.0.0 is available here and is supported by System Center Operations Manager 2012 or higher.

Two types of client monitoring are available in this management pack:

·    Aggregate client monitoring for gathering health information on the selected representative clients, and aggregating information for reports that display the trends

·    Monitoring of mission-critical business clients

It is also important to note that agentless monitoring is not supported

Loading

SCOM: Report subscription list could not be loaded. Client found response content type of ”, but expected ‘text/xml’.

Just the thing you want to see on a Monday morning, clicking on the Reports node and seeing the following error:

Message: Report subscription list could not be loaded.

System.InvalidOperationException: Client found response content type of ”, but expected ‘text/xml’.
The request failed with an empty response.
at System.Web.Services.Protocols.SoapHttpClientProtocol.ReadResponse(SoapClientMessage message, WebResponse response, Stream responseStream, Boolean asyncCall)
at System.Web.Services.Protocols.SoapHttpClientProtocol.Invoke(String methodName, Object[] parameters)
at Microsoft.EnterpriseManagement.Mom.Internal.UI.Reporting.ReportingService.ReportingService2005.ListSubscriptions(String Report, String Owner)
at Microsoft.EnterpriseManagement.Mom.Internal.UI.Reporting.ManagementGroupReporting.GetSubscriptions(String owner)
at Microsoft.EnterpriseManagement.Mom.Internal.UI.Reporting.Views.ReportSubscriptionsView.ReportSubscriptionsView.LoadSubscriptionsJob(Object sender, ConsoleJobEventArgs args)

An investigation determined that the reporting services action account needed to be re-registered to the ASP.NET IIS framework using the following command.

aspnet_regiis -ga <Domain\reporting services action account>

Loading

XPost: Event 18054 errors in the SQL application log

Here is a great post by Kevin Holman addressing an issue you would come across if you have had to move your SCOM databases or recover them to a new SQL server.

Sample error:

Log Name:      Application
Source:        MSSQL$I01
Date:          10/23/2010 5:40:14 PM
Event ID:      18054
Task Category: Server
Level:         Error
Keywords:      Classic
User:          OPSMGR\msaa
Computer:      SQLDB1.opsmgr.net
Description:
Error 777980007, severity 16, state 1 was raised, but no message with that error number was found in sys.messages. If error is larger than 50000, make sure the user-defined message is added using sp_addmessage.

In essence this happens, as explain, due to the sysmessages being created in the master database on installation. These messages will then be missing after a database move or new sql server recovery.

Kevin has also provided a script to re-add these messages for you here – CAUTION for SCOM 2012 R2 only

Loading