Tag Archives: #2012

XPost: SCOM 2016 Now supports SQL 2012 SP3

Additional support is now available for SCOM 2016 for SQL 2012 SP3. this will more easily facilitate the in-place upgrade path from SCOM 2012 as previously you would need your environment to be using a SQL version supported by both SCOM versions  (SQL 2014 SP2)

Kevin Holman has a nice article hi-lighting the different supported versions you can find it here

Loading

SCOM: Updated MP for Windows Server v10.0.8.0

A new version of the Windows Server MP has been released version 10.0.8.0 can be found here

There are quite a few changes so as usual test in your labs where possible before deploying to live environments.

New in this version

  • Added two new object types (Windows Server 2016 Computer (Nano) and Windows Server 2016 Operation System (Nano)) and a new group type (Windows Server 2016 Computer Group (Nano)). This improvement will help users to differentiate the groups and object types and manage them more accurately.
  • Added a new monitor: Windows Server 2016 Storport Miniport Driver Timed Out Monitor; the monitor alerts when the Storport miniport driver times out a request.
  • Fixed bug with duplicating Nano Server Cluster Disk and Nano Server Cluster Shared Volumes health discoveries upon MP upgrade. See Troubleshooting and Known Issues section for details.
  • Fixed bug with Windows Server 2016 Operating System BPA Monitor: it did not work.
  • Fixed bug with incorrect discovery of Windows Server Operating System on Windows Server 2016 agentless cluster computers occurring upon management pack upgrade. See Troubleshooting and Known Issues section for details.
  • Fixed bug: Free Space monitors did not work on Nano Server.
  • Changed the logic of setting the override threshold values for Free Space (MB and %) monitors: a user can set the threshold values for Error state even within Warning state default thresholds. At that, the Error state will supersede the Warning state according to the set values.
  • Fixed localization issue with root report folder in the Report Library.
  • Fixed bug: Windows Server 2016 Computer discovery was causing repeated log events (EventID: 10000) due to improper discovery of non-2016 Windows Server computers.
  • Fixed bug: [Nano Server] Cluster Seed Name discovery was causing repeated log events (EventID: 10000) due to improper discovery of non-Nano objects.
  • Due to incompatibility issues in monitoring logic, several Cluster Shared Volumes MP bugs remained in version 10.0.3.0. These are now fixed in the current version (see the complete list of bugs below). To provide compatibility with the previous MP versions, all monitoring logic (structure of classes’ discovery) was reverted to the one present in version 10.0.1.0.
    • Fixed bug: disk free space monitoring issue on Quorum disks in failover clusters; the monitor was displayed as healthy, but actually it did not work and no performance data was collected.
    • Fixed bug: logical disk discovery did not discover logical disk on non-clustered server with Failover Cluster Feature enabled.
    • Fixed bug: Cluster Shared Volumes were being discovered twice – as a Cluster Shared Volume and as a logical disk; now they are discovered as Cluster Shared Volumes only.
    • Fixed bug (partially): mount points were being discovered twice for cluster disks mounted to a folder – as a cluster disk and as a logical disk. See Troubleshooting and Known Issues section for details.
    • Fixed bug: Cluster Shared Volume objects were being discovered incorrectly when they had more than one partition (applied to discovery and monitoring): only one partition was discovered, while the monitoring data was discovered for all partitions available. The key field is changed, and now partitions are discovered correctly; see Troubleshooting and Known Issues section for details.
    • Fixed bug: Windows Server 2008 Max Concurrent API Monitor did not work on Windows Server 2008 platform. Now, it is supported on Windows Server platforms starting from Windows Server 2008 R2.
    • Fixed bug: when network resource name was changed in Failover Cluster Management, the previously discovered virtual computer and its objects were displayed for a short time, while new virtual computer and its objects were already discovered.
    • Fixed bug: performance counters for physical CPU (sockets) were collected incorrectly (for separate cores, but not for the physical CPU as a whole).
    • Fixed bug: Windows Server 2016 Operating System BPA monitor was failing with “Command Not Found” exception. Also, see Troubleshooting and Known Issues section for details on the corresponding task.
    • Fixed bug: View Best Practices Analyzer compliance task was failing with exception: “There has been a Best Practice Analyzer error for Model Id”.
    • Fixed bug: in the Operations Console, “Volume Name” fields for logical disks, mount points, or Cluster Shared Volumes were empty in “Detail View”, while the corresponding data was entered correctly.
    • Fixed bug: Logical Disk Fragmentation Level monitor was not working; it never changed its state from “Healthy”.
    • Fixed bug: Logical Disk Defragmentation task was not working on Nano Server.
    • Fixed bug: If network resource name contained more than 15 symbols, the last symbols of the name was cut off, which was resulting in cluster disks and Cluster Shared Volume discovery issues.
    • Fixed bug: Logical Disk Free Space monitor did not change its state. Now it is fixed and considered as deprecated.
  • The Management Pack was checked for compatibility with the latest versions of Windows Server 2016 and updated to support the latest version of Nano Server.
  • Added new design for CPU monitoring: physical and logical CPUs are now monitored in different way.
  • Updated Knowledge Base articles and display strings.
  • Improved discovery of multiple (10+) physical disks.
  • Added compatibility with Nano installation.

Loading

SCOM: Updated Office 365 MP v7.1.5134.0

A new version of the O365 MP is available get it here

New in version 7.1.5134.0

  • Upgraded subscriptions authorization method: the monitoring is carried out by an Azure application, not a specific user. Introduced two options to create an application, essential for the monitoring: manual and automatic: Microsoft Office 365 Global Administrator credentials are required for the automatic option of Azure application creation, while Azure subscription can be used for the second (manual) option. See Managing Office 365 Subscriptions section for more details.
  • Added Message Center messages categorization (see “Office 365 Incidents and Messages” section for details).
  • Added a new Message Center messages type: Planned Maintenance.
  • The Management Pack now inquires Office 365 Service Communications API V2; added a possibility to customize the endpoints and resource URIs in advanced subscription settings of the Office 365 wizard while calling the API. The above changes are provided for further support of Chinese subscriptions.
  • Added “Configuring Proxy Connection” section to the guide;
  • Fixed bug: if there were several locales (Australian, Russian, etc.) present on the workstation, the monitoring was stopping.
  • Updated “Known Issues” section of the guide.

Loading

SCOM: Updated SQL Server Management Packs v6.7.7.0

New versions of the SQL Server management packs are out! They are available from the below links:

Note: Be aware that there have been some serious issues with previous versions of the SQL management packs this year. I cannot stress enough the need for testing before using these in a live environment.

SQL Server 2016: here
SQL Server 2014: here
SQL Server 2008 / 2012: here
SQL Dashboards: here

New in this version

SQL Server 2008 / 2012

  • Fixed issue: SQL Server 2012 Always On discoveries fail after stopping WSFC service
  • Fixed issue: “Set DB offline” task does not work when the database is in Availability Group
  • Fixed issue: user policy discovery script fails with “Invalid namespace “ROOT\Microsoft\SqlServer\ComputerManagement12″‘ error
  • Fixed issue: Always On console task does not work
  • Updated the visualization library

SQL Server 2014 / 2016

  • Fixed issue: “Set DB offline” task does not work when the database is in Availability Group
  • Fixed issue: Always On console task does not work
  • Updated the visualization library

Dashboards

  • Fixed issue: expanding “arrow” has low-contrast color when a health group is collapsed in Instance view (High-Contrast #2 color scheme)
  • Fixed issue: in Web console, Dashboards continuously send requests to the database
  • Fixed issue: not the first object gets selected in the object list after drill-down
  • Fixed issue: horizontal scroll position resets after refreshing the Instance view
  • Fixed issue: “No Data” message is displayed on some tiles after upgrading Dashboards management pack from version 6.7.2.0 to 6.7.4.0 or later version
  • Fixed issue: on Web console, Dashboards crash when drilling down from Datacenter view to Instance view
  • Restored the correct group order in SQL Server Summary dashboard views

Loading

SCOM: Alerting when a server is up for more than X days

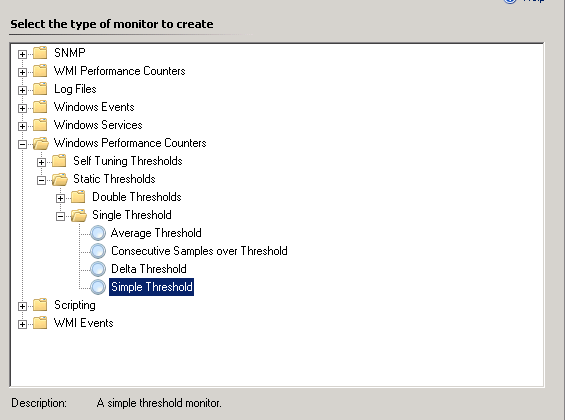
If you ever need to alert if a server has been online for more then a specific time period, you can achieve this with the following method. In this example we will be alerting if the server is up for more than 60 days.

Firstly create a unit monitor >  Windows Performance Counter < Single Threshold > Simple Threshold, targeting a relevant target, in this case we used Windows Computer.

41

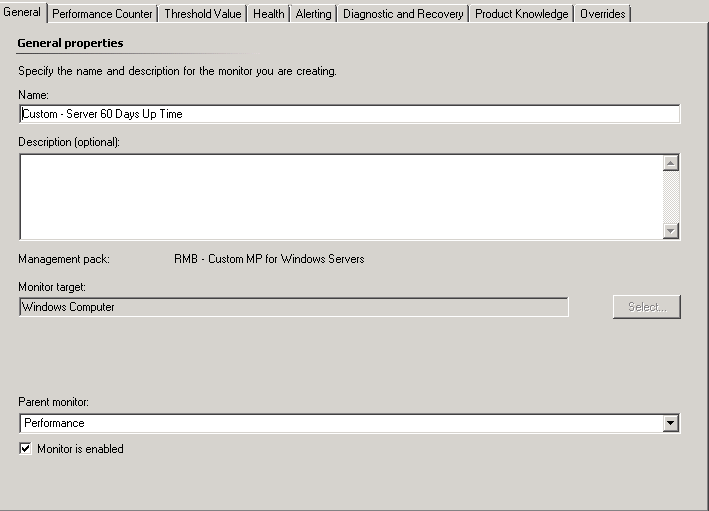
Then specify the performance counter to target the System Up Time Counter which is part of the System Object,

2

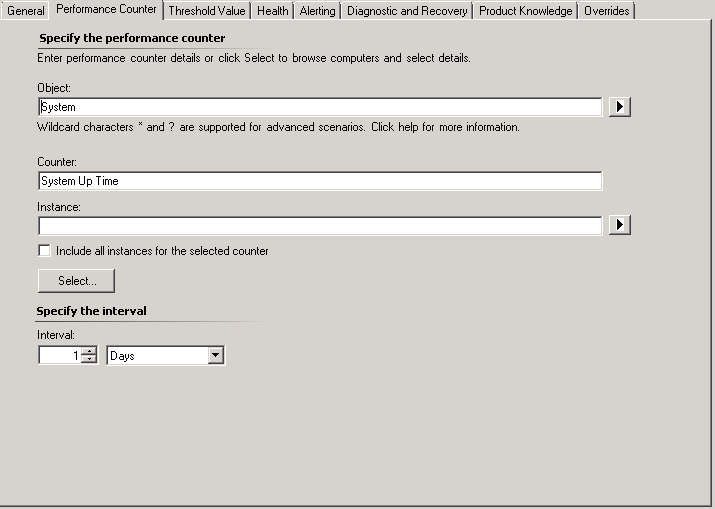
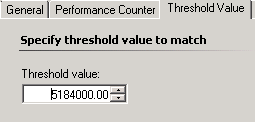
The threshold value is in seconds and needs to be set according to your requirement, in our case 60 days is 5184000 seconds.

3

You can then leave the alert details as is or specify a custom message. You will now get an alert for any server that is online for more then 60 days,

Loading

SCOM: Understanding Optimized Collection

This posting is a follow on in my SCOM basics series.

Lets start with what is Optimized Collection?

Optimization for a collection rule only collects a value if it differs from the previous sample by a specified tolerance. This is used to reduce network traffic and the amount of data stored in the Operations Manager database.

1

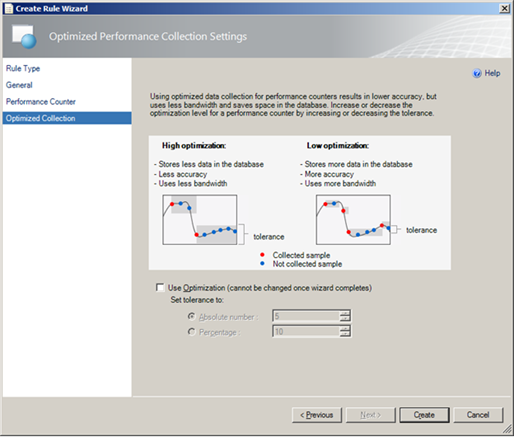
How does this affect me?

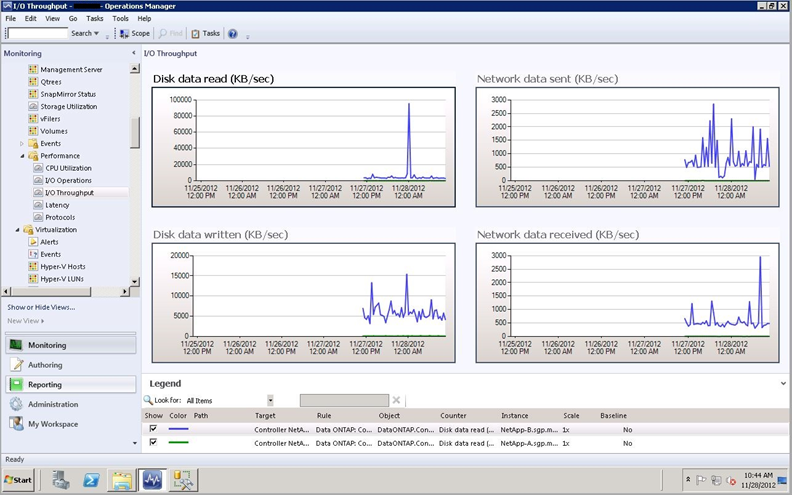
When viewing performance data you need to bear in mind that if the collection rule has optimization enabled then you may see gaps in your graphs if the value has not changed significantly for some time. The below image is an example of how this might look:

2

Note: Optimization should be used for performance counters that are expected to only change gradually. For counters that are expected to vary significantly from one value to the next, optimized collection should be disabled.

Loading

SCOM: SQL Server MP (Community Technical Preview 2.1)

An update to the SQL management packs Community Technical Preview is now available here.

There have been additions for SQL Server 2016 SSRS and SSAS and minor improvements to the other existing management packs. Hopefully when this reaches public release it will avoid the issues of previous SQL mp versions.

Newly released
SSRS Native Mode 2016
SSAS 2016

Updates and fixes

SQL Server 2005/ 2008 / 2012 / 2014 / 2016

  • Updated the visualization library

SQL Server 2008 /2012 / 2014 / 2016 Replication

  • Updated the visualization library

Dashboards

  • Improved Dashboards performance.

Loading

Xpost: SCOM getting resource pool members with powershell

A post I came across from Ian Blyth with a short powershell script to show which Resource Pools your management servers are part of. It’s quite useful to see all of the resource pool members in one place without having to open each one in the console, particularly in larger environments.

For a single managementserver

$Member = Get-SCOMManagementServer -Name “FQDN”
$Pools = Get-SCOMResourcePool -Member $Member
$Member.DisplayName
$Pools.DisplayName

For all management servers

$Members = Get-SCOMManagementServer
foreach ($member in $members)
{
write-host “”
$Pools = Get-SCOMResourcePool -Member $Member
write-host “Management Server – “$Member.DisplayName
$Pools.DisplayName
}

Loading

SCOM: SQL MP (Community Technical Preview 2) v6.7.0.0

Version 6.7.0.0 of the Community Technical Preview 2 for the SQL management packs have been released, they are available for download here.

Microsoft seems to be very cautions now with releases of the SQL MP which is good considering the issues with the last 4 live versions,

What’s new?

New Releases
MP for SSAS 2016
MP for SSRS 2016 (Native Mode)

Updates and fixes

SQL Server Dashboards

  • Added a feature to support Virtual Groups (groups defined by classes, not by real group instance). This will help users with partial access to use our predefined dashboards.
  • Added a feature to Bulk Add tiles from the class definition.
  • Added a feature to ignore some states while calculating the worst state for the Datacenter View State Tile; added a feature to set this ignorance up for each group
  • Added a feature to show/hide Instance path in the list on the Instance view
  • Added instance path to the Instance Details
  • Implemented deferred loading of the instance tiles to make the instance view operation faster
  • Implemented a new format for Dashboards configuration providing a smaller size and a single binding
  • Implemented a converter from old to new format providing preservation of user changes
  • Improved error reporting
  • Improved performance of initial load process
  • Improved data sources performance
  • Improved performance of instance selection (made it asynchronous)
  • Improved performance of Datacenter and Instance View Tiles, loading and loaded animations
  • Fixed animation issues and minor visual glitches (positioning, size of elements, fonts, main loading animation)
  • Updated Summary dashboard
  • “Known issues and Troubleshooting” section of the guide is updated

SQL Server 2016 / 2014

  • Fixed Smart Admin policies monitoring
  • Fixed Always On Database replica discovery incorrect behavior; fixed Always On policies discovery and monitoring
  • Fixed Database policies discovery and monitoring
  • Fixed and optimized CPU Usage monitoring scripts (the issue appeared when only one core was assigned)
  • Added support for more than 32 processors count in CPU Usage monitoring.
  • SQLPS module is now used for the tasks instead of deprecated SQLPS.EXE
  • Implemented FILESTREAM filegroup monitoring
  • FILESTREAM is now supported on the summary dashboard
  • Multiple Ports are now supported in SQL Server TCP/IP parameters
  • Fixed error occurring when no port is specified in SQL Server TCP/IP parameters
  • Fix filegroup read-only state discovery
  • Fixed RunAs profiles mapping for some workflows
  • Added support for new SQL Server 2016 Memory-Optimized Data implementation
  • Implemented support for TLS 1.2 in connection logic
  • Implemented support for different client drivers in connection logic
  • Updated connection logic error logging
  • Updated Availability Group Automatic Failover monitor
  • Added rules to collect new Always On performance counters
  • Updated SMO usage in Always On workflows to support the new connection logic
  • Upgraded the used PowerShell version to 3+, since SQL Server 2016 uses .Net 4 Runtime
  • Fixed issue: CPU usage monitor ignored SQL server limitations on CPU core count
  • Fixed display strings and Knowledge Base articles
  • Fixed error reporting in the scripts
  • Fixed threshold percentage comparison of deactivated subscriptions workflow in Distributor.

SQL Server 2016 / 2014 / 2012 / 2008 Replication

  • Reviewed threading implementation
  • Fixed issue: Distributor Discovery could fail for Replication
  • Fixed error logging, added more details
  • Fixed “Availability of the Distribution database” monitor issue: added missing overridable parameter
  • Assigned SDK profile to the Replication Database Health Discovery
  • Fixed replication monitoring issue: compatibility with SQL 2005 as a part of Replication
  • Fixed Publisher Discovery issue: unable to cast object of type ‘System.DBNull’ to type ‘System.String’
  • Added timeout support for .Net modules
  • Fixed issue: SQL Server Event Log Collection Target was not discovered Associate due to invalid path in DataSource
  • Fixed Replication Agent State monitor type cookdown issue
  • Fixed issue: failing replacement warning in “One or more of the Replication Agents are retrying on the Distributor” monitor
  • Dashboards fixes: added bindings to the tiles; added Datacenter Classes (L1 dashboard for Replication)
  • Fixed upgradeability
  • Fixed Knowledge Base articles and display strings
  • Updated Known Issues and Troubleshooting section of the guide

Loading