Monthly Archives: October 2014

SCOM: Updated Exchange 2013 MP version 15.0.652.19

The original version of the Exchange 2013 Management pack was quite feature poor and didn’t have any performance collection. It’s great to see that Microsoft is listening to the needs of its customers and has added features and generally improved this management pack over all.

The new version is available for download here.

Version 15.0.652.19 includes performance collection rules which were missing from the previous version as well as new views, group, dashboard and reporting.

The performance collections rules that are now included are listed below, as extracted from the MP guide:

Exchange 2013 Server
o    Exchange 2013 Database: I/O Database Reads Average Latency (ms)
o    Exchange 2013 Database: I/O Database Writes Average Latency (ms)
o    Exchange 2013 Database: I/O Log Reads Average Latency (ms)
o    Exchange 2013 Database: I/O Log Writes Average Latency (ms)
o    Exchange 2013 Database: Page Fault Stalls/sec
o    Exchange 2013 Server: Average Disk sec/Read
o    Exchange 2013 Server: Average Disk sec/Write
o    Exchange 2013 Server: Disk Free Space (MB)
o    Exchange 2013 Server: Disk Reads/sec
o    Exchange 2013 Server: Disk Size (MB)
o    Exchange 2013 Server: Disk Writes/sec
o    Exchange 2013 Server: Transport Queue Database Size (MB)
o    Exchange 2013 Server: Client Connections Count
o    Exchange 2013 Server: ActiveSync Pending
o    Exchange 2013 Server: Avg. Authentication Latency (ms)
o    Exchange 2013 Server: E2E Deliver <=90sec
o    Exchange 2013 Server: E2E Latency Percentile 95
o    Exchange 2013 Server: E2E Latency Send to External <=90sec
o    Exchange 2013 Server: EWS Response Time (ms)
o    Exchange 2013 Server: LDAP Search Time (ms)
o    Exchange 2013 Server: Messages Received/sec
o    Exchange 2013 Server: Messages Sent/sec
o    Exchange 2013 Server: Outstanding Proxy Requests
o    Exchange 2013 Server: HTTP Proxy Failure Rate (%)
o    Exchange 2013 Server: HTTP Proxy Requests/sec
o    Exchange 2013 Server: Queues by Type Count
o    Exchange 2013 Server: Queue Length
o    Exchange 2013 Server: Requests/sec
o    Exchange 2013 Server: Avg RPC Latency (ms)
o    Exchange 2013 Server: SMTP Bytes Received/Sec
o    Exchange 2013 Server: SMTP Bytes Sent/Sec
o    Exchange 2013 Server: SMTP Connections (Current)
o    Exchange 2013 Server: Store Messages Submitted/sec
o    Exchange 2013 Server: System Total Memory (MB)
o    Exchange 2013 Server: CPU Utilization (%)
o    Exchange 2013 Server: Private Memory Size (MB)
o    Exchange 2013 Server: Private Memory Size (%)

Exchange 2013 Windows Service
o    Exchange 2013 Windows Service: CPU Utilization (%)
o    Exchange 2013 Windows Service: Pool Non Paged Memory Size (MB)
o    Exchange 2013 Windows Service: Pool Paged Memory Size (MB)
o    Exchange 2013 Windows Service: Private Memory Size (MB)
o    Exchange 2013 Windows Service: Private Memory Size (%)

Exchange 2013 IIS Application Pool
o    Exchange 2013 IIS App Pool: Active Requests
o    Exchange 2013 IIS App Pool: Private Memory Size (%)
o    Exchange 2013 IIS App Pool: CPU Utilization (%)
o    Exchange 2013 IIS App Pool: Pool Non Paged Memory Size (MB)
o    Exchange 2013 IIS App Pool: Pool Paged Memory Size (MB)
o    Exchange 2013 IIS App Pool: Private Memory Size (MB)

Exchange 2013 Mailbox Database Copy
o    Exchange 2013 Mailbox Database: Available Space (MB)
o    Exchange 2013 Mailbox Database: Index Size (MB)
o    Exchange 2013 Mailbox Database: I/O Database Reads Average Latency (ms)
o    Exchange 2013 Mailbox Database: I/O Database Writes Average Latency (ms)
o    Exchange 2013 Mailbox Database: I/O Log Reads Average Latency (ms)
o    Exchange 2013 Mailbox Database: I/O Log Writes Average Latency (ms)
o    Exchange 2013 Mailbox Database: Transaction Log Available Space (MB)
o    Exchange 2013 Mailbox Database: Transaction Log Size (MB)
o    Exchange 2013 Mailbox Database: Database Page Fault Stalls/sec
o    Exchange 2013 Mailbox Database: Database Size (MB)

Exchange 2013 Organization
o    Exchange 2013 Organization Synthetic: Mailbox Count
o    Exchange 2013 Organization Synthetic: Client Connections Count
o    Exchange 2013 Organization Synthetic: E2E Deliver <=90sec
o    Exchange 2013 Organization Synthetic: E2E Latency Send to External <=90sec
o    Exchange 2013 Organization Synthetic: Mailbox Database Size (MB)
o    Exchange 2013 Organization Synthetic: Messages Received/sec
o    Exchange 2013 Organization Synthetic: Messages Sent/sec
o    Exchange 2013 Organization Synthetic: Store Messages Submitted/sec


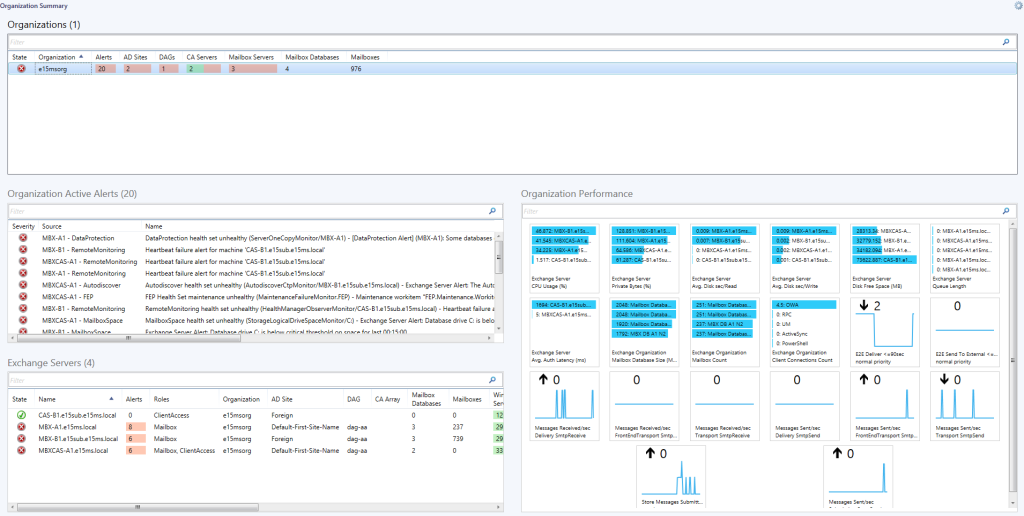
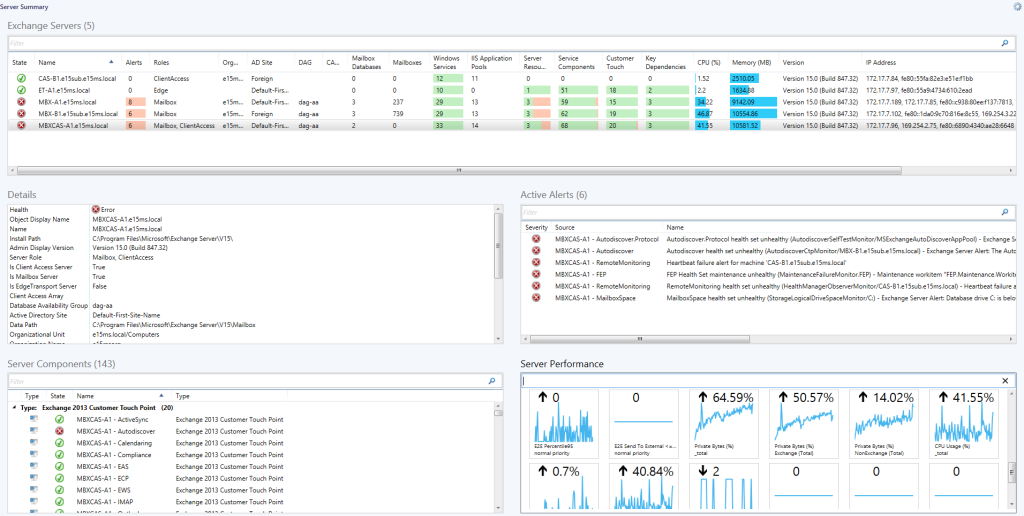
The new dashboards look to be quite useful containing an Organisational Overview and Server overview, which should be useful to the support team. I hope this is an example of the type of content we can expect to see in future management packs.

Organization Summary dashboard

db1

Server Summary dashboard

db2

Loading

SCOM 2012 R2: Update Rollup 4

Microsoft has released Update Rollup 4 for System Center 2012 R2 Operations Manager. All in all a good update and as always test in your labs before deploying to production,

It is available for download here and contains fixes for the following issues:

Issue 1
It takes many minutes for the Microsoft.Windows.CheckNTServiceStateMonitorType function to determine that the service is down.

Issue 2
An attempt to apply sensitivity rules fails, and you receive the following error message:

The monitoring configuration contains errors and cannot be applied.
Exception: System.ApplicationException: Attribute ‘regexCompare’ is null
at Microsoft.EnterpriseManagement.Modules.Apm.LibraryConfigManager.Tools.XmlTools.GetMandatoryAttribute(String attributeName, XmlNode node)
at any attempt to apply sensitivity rules fails with the errorMicrosoft.EnterpriseManagement.Modules.Apm.LibraryConfigManager.Modules.ApmModule.Core.Actions.AgentHandlersConfig.HiddenRuleXmlDeserializer.Deserialize(XmlNode rowData)

Issue 3
GSM locations are geotagged incorrectly on Map Widget.

Issue 4
The MonitoringHost.exe process issues too many calls to System Center Failover Clustering.

Issue 5
The re-synchronization of all managed entities from Operations Manager to the Operations Manager Data Warehouse database causes duplicate entries, and an exception that resembles the following is thrown:

Data was written to the Data Warehouse staging area but processing failed on one of the subsequent operations.
Exception ‘SqlException’: Sql execution failed. Error 2627, Level 14, State 1, Procedure ManagedEntityChange, Line 367, Message: Violation of UNIQUE KEY constraint ‘UN_ManagedEntityProperty_ManagedEntityRowIdFromDAteTime’. Cannot insert duplicate key in object ‘dbo.ManagedEntityProperty’.

Issue 6
If data is truncated and is in Terminal status to a workflow, event ID 31551 is logged, and an exception that resembles the following is thrown:

Failed to store data in the Data Warehouse. The operation will be retried.
Exception ‘InvalidOperationException’: The given value of type String from the data source cannot be converted to type nvarchar of the specified target column.
One or more workflows were affected by this.
Workflow name: Microsoft.SystemCenter.DataWarehouse.CollectAlertData

Issue 7
An arithmetic overflow error occurs, and an exception that resembles the following is thrown:
Data was written to the Data Warehouse staging area but processing failed on one of the subsequent operations.
Exception ‘SqlException’: Sql execution failed. Error 8115, Level 16, State 2, Procedure RelationshipChange, Line 180, Message: Arithmetic overflow error converting expression to data type int.

Issue 8
You experience poor performance when Operations Manager searches for attributes. Additionally, when doing more than one search in a row, the cache file (momcache.mdb) keeps increasing.

Issue 9
SCX agent generates lots of warnings in the log file when a user is using Security-Enhanced Linux (SELinux).

Issue 10
By default, the Rpcimap monitor for Red Hat Enterprise Linux 6 is disabled.

Loading

SCOM 2012: Translating Notification subscription ID to Subscription Name

If you ever need to get from a Notification subscription ID to the subscription name it is luckily quite easy to do.

First locate the following in the notification email Notification subscription ID generating this message:  02F7588F-3BEA-BE7A-A004-D4863FA1119D

Then use the following power shell command:

Get-SCOMNotificationSubscription -id <Notification ID > | ft DisplayName

and replace <Notification ID > with the Notification subscription ID, in this example 02F7588F-3BEA-BE7A-A004-D4863FA1119D

Get-SCOMNotificationSubscription -id 02F7588F-3BEA-BE7A-A004-D4863FA1119D | ft DisplayName

Loading

SCOM 2012: Maintenance Mode Scheduler updated to v4

The Maintenance mode scheduler tool written by Tim McFadden has been updated to version 4.

Here are the new features:

  • Multi-select Computers  This has been the most requested feature as end users often want to schedule multiple computers at a time without having to create groups.
  • Multi-select Computers in Integrated dashboard  Now you can select multiple computers in the dashboards without getting an error
  • New Search in Computers and Groups  Now instead of scrolling up in down the list you can just start to type in the name of the group or computer and results will be filtered.
  • One Click MM now accepts parameters   Some environments One Click MM was not working as the client security was high or there were DNS issues.  Now you can just add the computer as a parameter.
  • New Configuration backup tool for easier upgrades  Now you can back your configuration and upgrade to the latest version of SCOM 2012 Maintenance Mode Scheduler with have to reconfigure all of your settings.

More information is available here

Loading

How do I get a simple list of specific computers based on simple criteria?

Kevin Holman has started a series of FAQ posts based on the common questions he gets on a daily basis. The first in this series is Q:  I want a list of all my Windows 2008 Computers in SCOM.  How can I achieve this easily? 

The article is available here and explains in a clear manner how to create and use a state view in SCOM to achieve this.

Loading

SCOM: Updated Management Packs Oct 2014

Microsoft has released a new wave of Management Packs this month primarily around MSMQ (Microsoft Message Queuing) and Client Operating Systems also an update for the Azure MP.

Changes, download links and config guides can be found by following each link.

Client OS:

MSMQ:

Windows Azure:

  • Windows Azure – version 1.1.238.0 – Note this version only works with SCOM 2012 SP1 or higher

Loading

System Center: Technical Preview

With the upcoming news about Windows 10 Microsoft also released news of the new System Center Technical Preview.

The announcement is available here.

Please note that to evaluate System Center Technical Preview, you need to be running Windows Server Technical Preview and Microsoft SQL Server 2014.

Not many features have been revealed yet so watch this space.

Loading

SCOM: Performance views still show counters when performance collection rules are disabled

Microsoft recently released KB3002249 which details an issue whereby when performance collection rules are disabled in SCOM, performance views still show counters even after all the data is groomed out.

This effects all versions of SCOM and can make the PerformanceDataAllView difficult to read due to clutter.

“This issue is by design. The Operations Manager grooming processes does not groom the PerformanceSource table.”

The below query can be used to see which performance counters will be deleted for what objects before you run the delete script:

Use OperationsManager select PS.PerformanceSourceInternalId, BME.BaseManagedEntityId, BME.DisplayName, PC.CounterName, PC.ObjectName, PS.TimeAdded, PS.LastModified, PDA.PerformanceSourceInternalId from PerformanceSource PS left join PerformanceDataAllView PDA on PDA.PerformanceSourceInternalID = PS.PerformanceSourceInternalId join PerformanceCounter PC on PC.PerformanceCounterId = PS.PerformanceCounterId join BaseManagedEntity BME on BME.BaseManagedEntityId = PS.BaseManagedEntityId where PDA.PerformanceSourceInternalId IS NULL


The following is a small SQL script that will remove the entries from PerformanceDataAllView for which no data is recorded.

Note Stop all the Operations Manager services on all Management Servers before you run the script. Always back up your OperationsManager Database before you run this script.

Use OperationsManager
delete from PerformanceSource where PerformanceSourceInternalId in 
(
select PS.PerformanceSourceInternalId from PerformanceSource PS
left join PerformanceDataAllView PDA on PDA.PerformanceSourceInternalID = PS.PerformanceSourceInternalId
where PDA.PerformanceSourceInternalId IS NULL
)

Loading