Monthly Archives: September 2019

SCOM 2016: UR 8 is now available!

Update Rollup 8 for SCOM 2016 is now available, as usual you can get it through windows update or via the download catalogue here

Improvements and fixes


  • Fixed: In a scenario where SCOM monitors 100s of virtual machines hosted on a single Hyper-v server; every hour the healthservice.exe of each Virtual machine write into the VM page file simultaneously. Due to this concurrent paging, every hour disk I/O increases and database becomes unresponsive. HealthService.exe now have Memory Trimming enabled by default on an hourly schedule. A registry key is provided to disable the memory trimming and control the duration.

          Registry key is: “HKLM\Software\Microsoft\Microsoft Operations Manager\3.0\Setup\MemoryTrimming”

         Enable – 0 (Trimming is disabled); 1 (trimming is enabled)

         DelayInSeconds – Time period agent waits to start trimming (default is 120s)

         PeriodInSeconds – Recurring period at which the working set should be  trimmed (default is 3600s)

  • Fixed: Historical data do not appear, if input reporting end time is before group creation time. With this fix, historic data for a group (if data is available for objects in the group) would be displayed irrespective of group creation time.
  • Fixed: Maintenance mode state changes which are recorded in MaintenanceModeStage table requires grooming when table grows. If the table is large, grooming takes longer and the operation times out with SQLTimeOut exception.
  • Fixed: If a group is renamed in a Management pack, then console shows the new value but Powershell command Get-SCOMGroup returns the old name of group. Database Updates functionality was inconsistent for SCOM group renaming through MP and SCOM Console.
  • Fixed: CPU Spike issues because of workflows running on all agents at the same time is addressed through script optimization and removing the sync time.
  • Fixed: If the registry key under “Computer\HKey_Local_Machine\Software\Microsoft\Microsoft Operations Manager\3.0\Setup\UseMIApi” is set and a Unix/Linux Script task without a parameter is executed then this task fails. 
  • Improvement: Sometimes SQL stored procedure “p_SelectForNewTypeCache” takes long time to complete, and SDK service fails to start. This is fixed and above SQL stored procedure will complete faster now.

Loading

How to: Availability Workbook for Azure Monitor

Azure Monitor workbooks are very powerful and a great addition to the Monitor toolset you can learn more about them in my article here. Today we’ll be using Workbooks to create an availability report for our servers.

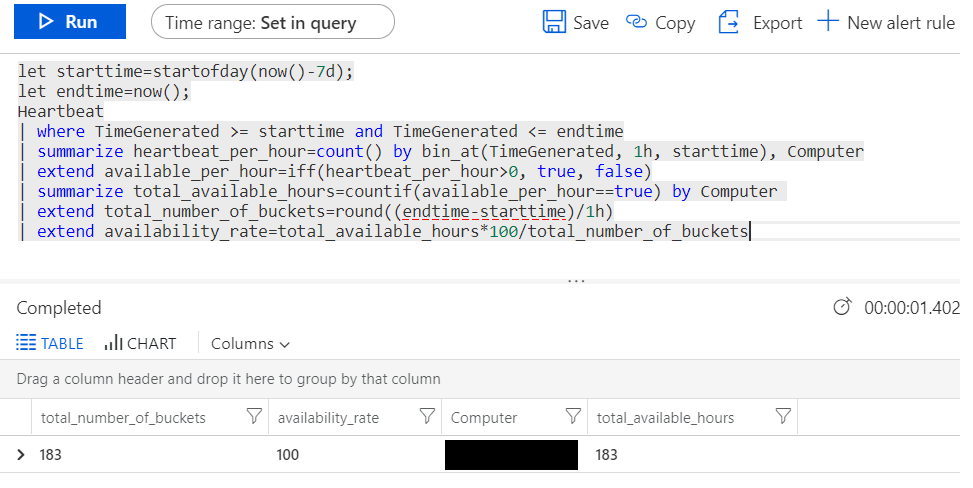
First we need our query, below is a fairly stock example of how to use the Heartbeat table to get the number of hours a server has been online and compare that to a set number of hours, in this case the past 7 days (168 hours) and work that out as a percentage.

let starttime=startofday(now()-7d);
let endtime=now();
Heartbeat
| where TimeGenerated >= starttime and TimeGenerated <= endtime
| summarize heartbeat_per_hour=count() by bin_at(TimeGenerated, 1h, starttime), Computer
| extend available_per_hour=iff(heartbeat_per_hour>0, true, false)
| summarize total_available_hours=countif(available_per_hour==true) by Computer
| extend total_number_of_buckets=round((endtime-starttime)/1h)
| extend availability_rate=total_available_hours*100/total_number_of_buckets

As you can see running this query against your Log Analytics workspace will return exactly that, The Computer name, the total number of hours or “buckets”, the number of available hours and the percentage or Availability rate.

Once we have a working query it’s time to create our workbook, this can be done under the Azure Monitor blade of the Azure console, simple click on Workbooks which is still in preview and then click new.

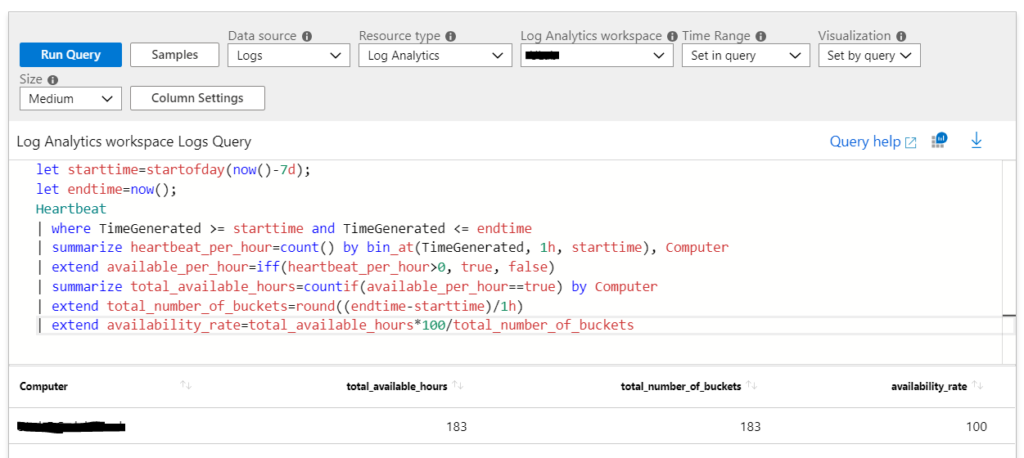
Click add query and configure your workspace as shown below, then click Run Query

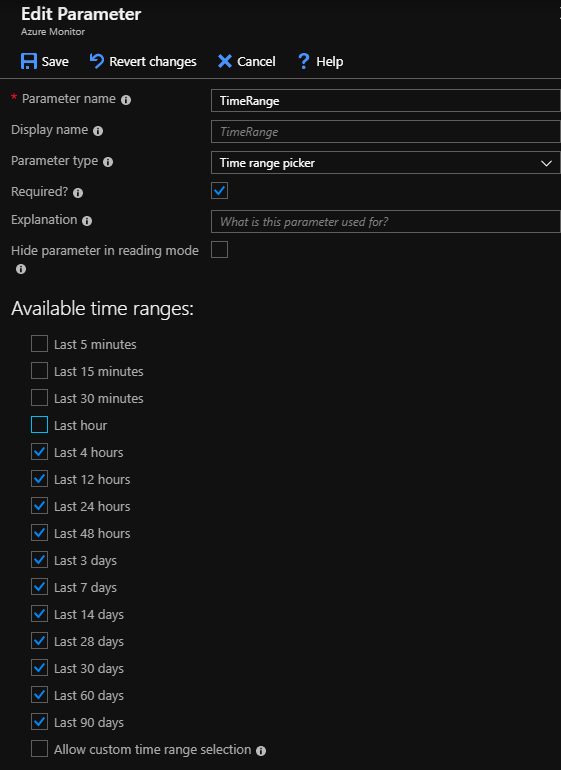
So far so good, now we want to be able to select the time range for our availability report. to do this click add Parameters at the bottom of the editor. Conveniently there is a pre-built parameter called Time range picker so we’ll use that. Make sure you tick required to make this mandatory for the Workbook.

Save your new parameter and then click the up arrow to move this section to the top of the page.

Now our query needs a slight adjustment to be able to use the time picker, below you can see I’ve created variables for the time ranges and substituted them into my query in the relevant locations.

let timeRangeStart = {TimeRange:start};
let timeRangeEnd = {TimeRange:end};
Heartbeat
| where TimeGenerated >= timeRangeStart and TimeGenerated <= timeRangeEnd
| summarize heartbeat_per_hour=count() by bin_at(TimeGenerated, 1h, timeRangeStart), Computer
| extend available_per_hour=iff(heartbeat_per_hour>0, true, false)
| summarize total_available_hours=countif(available_per_hour==true) by Computer
| extend total_number_of_buckets=round((timeRangeEnd-timeRangeStart)/1h)
| extend availability_rate=total_available_hours*100/total_number_of_buckets

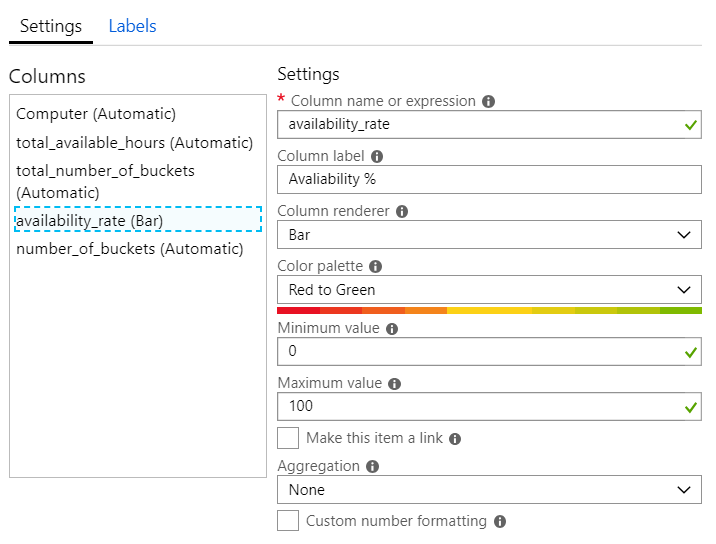
Lastly we want to add a bit of colour to the report, a nice way to do this is to click on the Column Settings button, select availability rate and configure it to display as a bar. Making the colour palette Red to Green also means that the higher the number the more green the bar becomes allowing servers with poor availability to stand out.

Click save and there you have it a Server Availability Workbook for Azure Monitor. Save this workbook and you can access it from the workbook gallery and also pin it to an existing Azure Dashboard.

Loading

Management Pack Recap – July & August 2019 Wave

This is a summary of the wave of Management Packs that were released in July & August 2019. Information and download location in the links provided:

SQL SSRS & SSAS 7.0.17.0here

HP Storage v9.4here

If you know of any other Management Packs that have been released recently that I may have missed leave me a note in the comments and I’ll add them

Loading