
Azure Monitor workbooks are very powerful and a great addition to the Monitor toolset you can learn more about them in my article here. Today we’ll be using Workbooks to create an availability report for our servers.
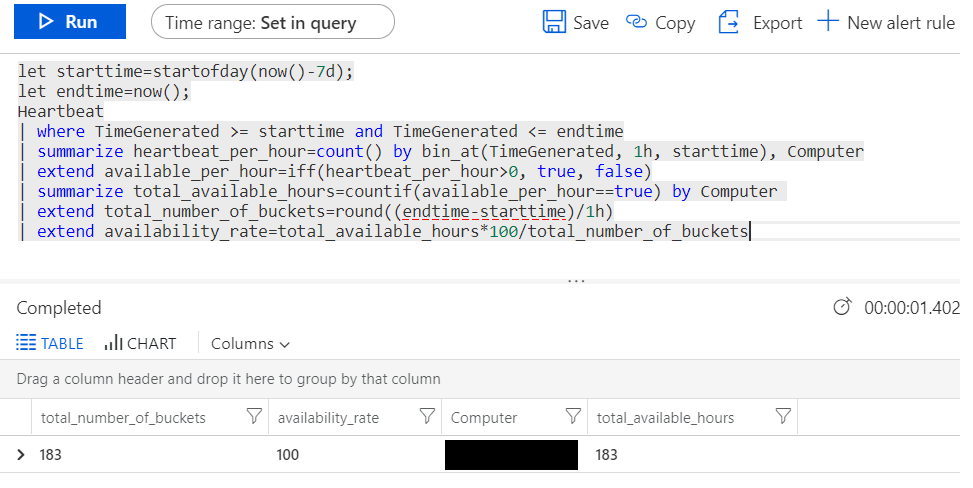
First we need our query, below is a fairly stock example of how to use the Heartbeat table to get the number of hours a server has been online and compare that to a set number of hours, in this case the past 7 days (168 hours) and work that out as a percentage.
let starttime=startofday(now()-7d);let endtime=now();Heartbeat| where TimeGenerated >= starttime and TimeGenerated <= endtime| summarize heartbeat_per_hour=count() by bin_at(TimeGenerated, 1h, starttime), Computer| extend available_per_hour=iff(heartbeat_per_hour>0, true, false)| summarize total_available_hours=countif(available_per_hour==true) by Computer | extend total_number_of_buckets=round((endtime-starttime)/1h)| extend availability_rate=total_available_hours*100/total_number_of_buckets
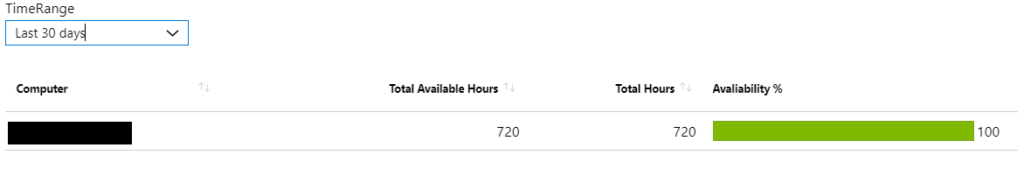
As you can see running this query against your Log Analytics workspace will return exactly that, The Computer name, the total number of hours or “buckets”, the number of available hours and the percentage or Availability rate.
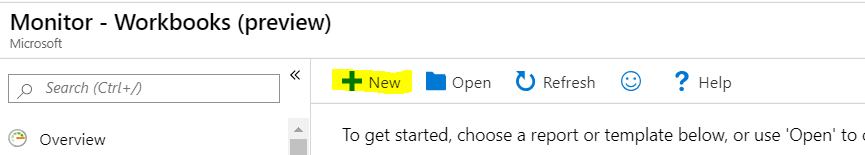
Once we have a working query it’s time to create our workbook, this can be done under the Azure Monitor blade of the Azure console, simple click on Workbooks which is still in preview and then click new.
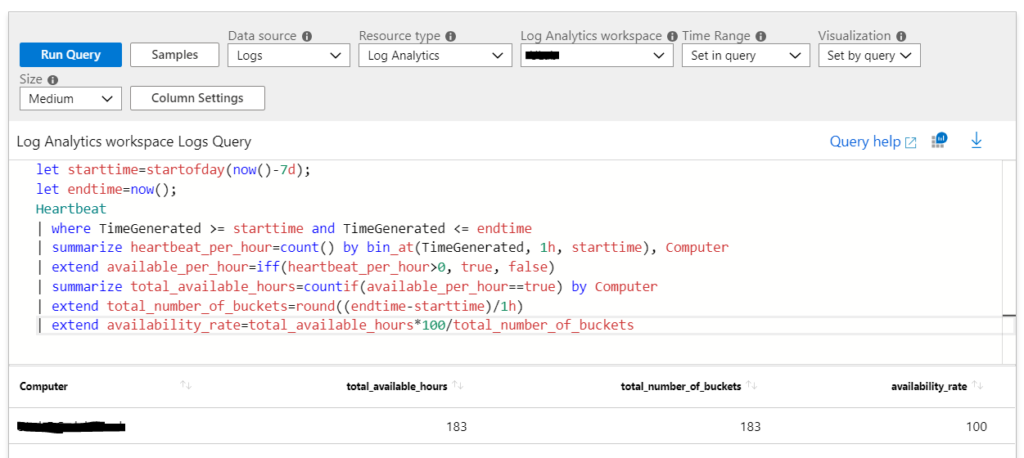
Click add query and configure your workspace as shown below, then click Run Query
So far so good, now we want to be able to select the time range for our availability report. to do this click add Parameters at the bottom of the editor. Conveniently there is a pre-built parameter called Time range picker so we’ll use that. Make sure you tick required to make this mandatory for the Workbook.
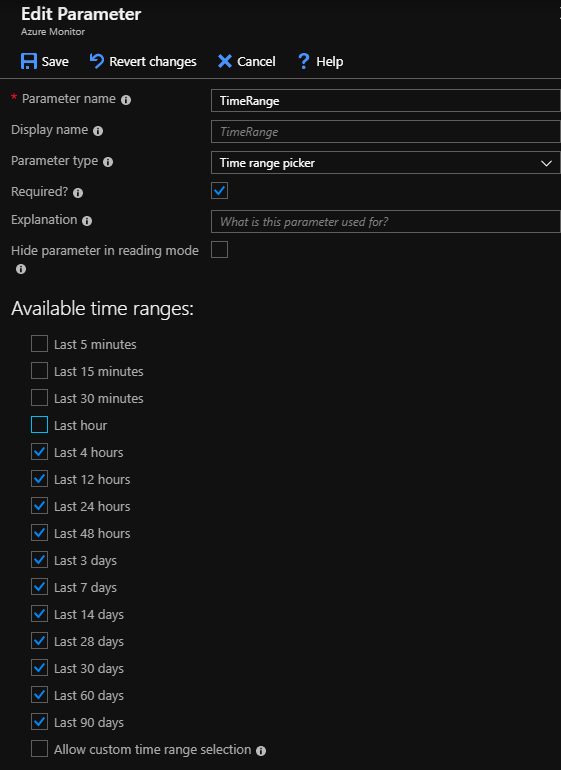
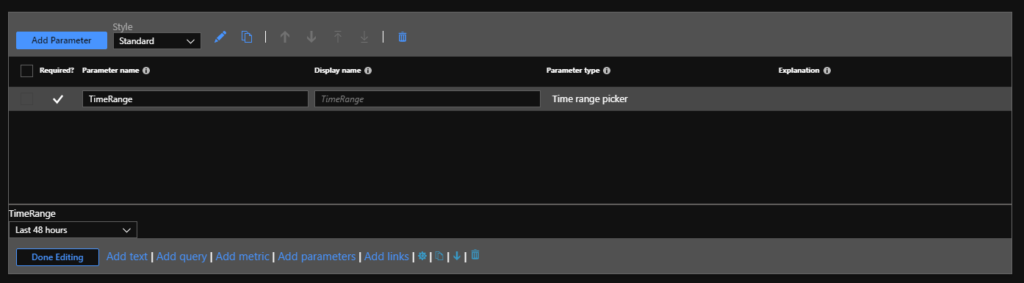
Save your new parameter and then click the up arrow to move this section to the top of the page.
Now our query needs a slight adjustment to be able to use the time picker, below you can see I’ve created variables for the time ranges and substituted them into my query in the relevant locations.
let timeRangeStart = {TimeRange:start};let timeRangeEnd = {TimeRange:end};Heartbeat| where TimeGenerated >= timeRangeStart and TimeGenerated <= timeRangeEnd| summarize heartbeat_per_hour=count() by bin_at(TimeGenerated, 1h, timeRangeStart), Computer| extend available_per_hour=iff(heartbeat_per_hour>0, true, false)| summarize total_available_hours=countif(available_per_hour==true) by Computer | extend total_number_of_buckets=round((timeRangeEnd-timeRangeStart)/1h)| extend availability_rate=total_available_hours*100/total_number_of_buckets
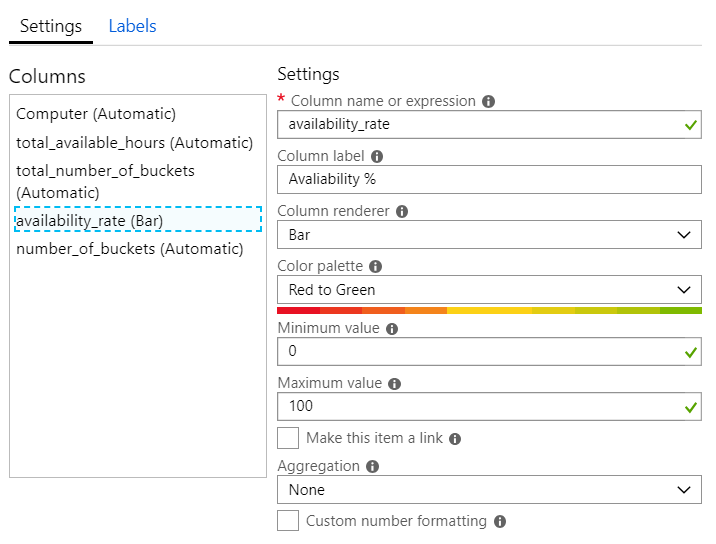
Lastly we want to add a bit of colour to the report, a nice way to do this is to click on the Column Settings button, select availability rate and configure it to display as a bar. Making the colour palette Red to Green also means that the higher the number the more green the bar becomes allowing servers with poor availability to stand out.
Click save and there you have it a Server Availability Workbook for Azure Monitor. Save this workbook and you can access it from the workbook gallery and also pin it to an existing Azure Dashboard.
![]()
Pingback: System Center Eylül 2019 Bülten – Sertaç Topal