Recently announced the preview for Azure Managed Grafana is now available. For those who maybe don’t know Grafana is an observability platform which lets you create mixed data dashboards form a variety of sources.
And now you can run it in Azure!
Lets get started
First you need to create a Grafana workspace, in the Azure Portal search for Azure Managed Grafana select it and click +Create. Fill out all the usual suspects, choosing your subscription, resource group, location and workspace name.

On the following tab create a managed identity as this is the way Grafana will be able to access data from your resources. Then create your workspace.

Next we need access
Grafana needs access to the resources you want to build dashboards for, you can easily do this with Azure RBAC and it can easily be done at the resource group or subscription level as well.
Using Access Control (IAM) give Monitoring reader access to the Managed Identify you created as part of your Grafana workspace

Lets make some dashboards
First lets open our Grafana, navigate to the workspace previously created and click on the endpoint address on the Overview blade

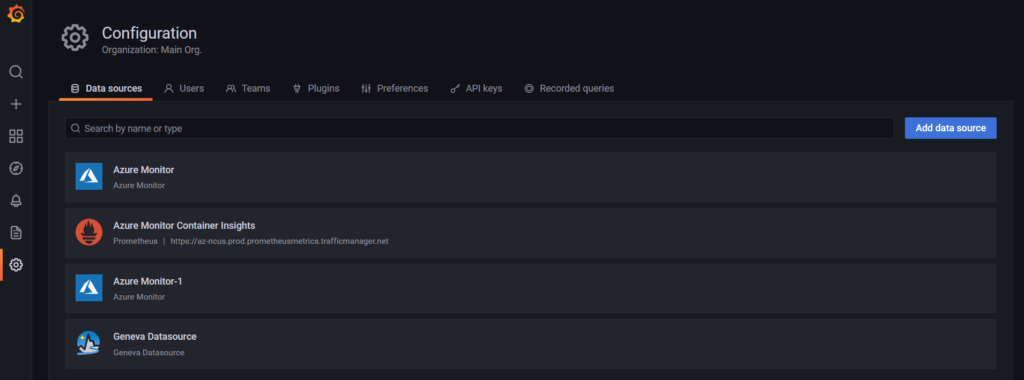
On the landing page there’s a notification to configure a data source. We’ll be using Azure Monitor, simply click add data source and choose Azure Monitor from among all of the available options, we can see here that there are plenty to choose from which is part of the power of Grafana.

Name your connection, choose managed identify and select the relevant subscription. Then click Save & test

A nice feature is the ability to access pre-built dashboards out of the box, clicking on the Dashboards tab shows us several options which we can import with the click of a button.

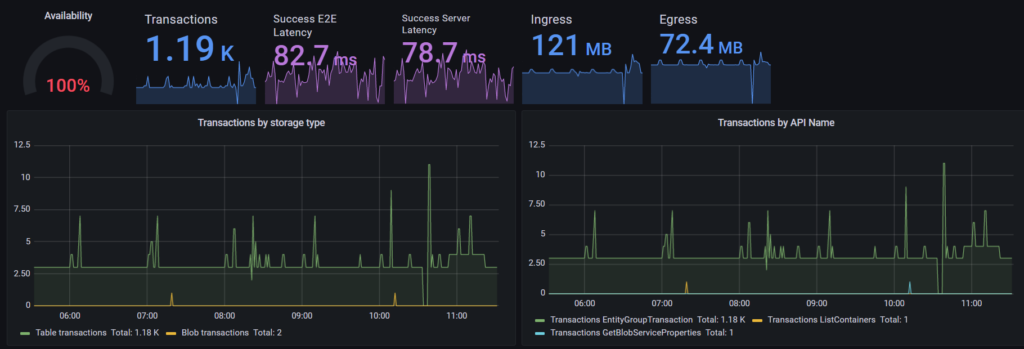
And we’re all set below is an example of the Azure Storage Insights dashboard which I was able to configure from start to finish in less than 5 minutes.

Overall, Azure Managed Grafana is very cool and offers an alternative approach to mixed data dashboards from a variety of sources. Of course, you can also create customized visuals and there are plenty of options to ensure you end up with something meaningful and perfect for your needs. I’m looking forward to seeing this go GA.
Happy dashboarding!
![]()
