Update Rollup 9 for System Center 2012 SP1has just been released, this KB article contains full information around the included fixes. The article also contains the installation instructions and download link.
![]()

Update Rollup 9 for System Center 2012 SP1has just been released, this KB article contains full information around the included fixes. The article also contains the installation instructions and download link.
![]()
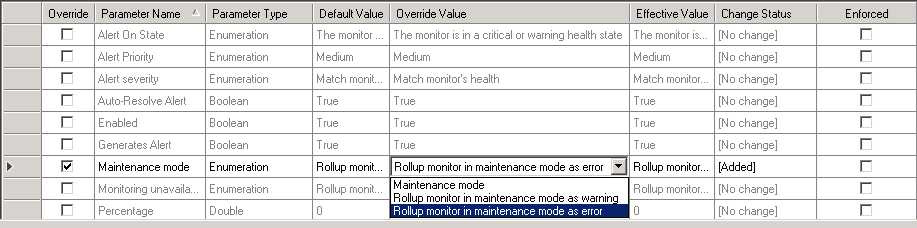
One of my colleagues brought an issue to my attention whereby placing a Cluster server into maintenance mode was causing a flood of “Cluster resource or group offline or partially online” alerts from that clusters resource groups.
It turns out that the default maintenance mode setting for the Resource Group dependency rollup monitor is “Rollup monitor in maintenance mode as error”. This means that any objects rolling up as maintenance mode will cause the resource group monitor to go critical and generate “Cluster resource or group offline or partially online” alerts.
Changing the value to maintenance mode alleviates this issue. I’ve also has success placing the resource groups into maintenance mode before the cluster objects.
![]()
Oktagonal, a company that specialises in infrastructure automation has released a Maintenance Mode scheduler tool for SCOM 2012.
Go here for additional information and pricing. A 30 day trial is also available.
Features:
I particularly like the ability to convert the tech heavy SCOM object names into easy to identify object names and the ability to restrict who can schedule maintenance for which object without requiring console access and we all know how useful auditing is when it comes to maintenance mode.
Definitely a useful tool, I look forward to seeing later iterations.
![]()
Veeam has released a new version of their popular Report Library for System Center, this version, 7.0 R2 follows the release of the hyper-v enabled Veeam Management Pack v7 for System Center and is available for download here.
![]()
December is quite an eventful month for Management Pack updates, IBM has just released version 2.3.0 of their IBM Storage Management Pack. As always it is available for download on the IBM Fix Central website (www.ibm.com/support/fixcentral).
This update adds support for the XIV multi-tenancy feature:
Enhancement: Added support for the XIV multi-tenancy feature, which applies only to XIV microcode version 11.5 or later (non-domain users have access only when the access policy is set to “Open”).
Fixed: For SAN Volume Controller and Storwize systems, cluster monitoring is dependent on FlashCopy® consistency group unit monitoring, while single system monitoring is dependent on array unit monitoring. If either of the required unit monitoring is not used, the cluster or system monitoring returns to the uninitialized state.
Fixed: Updated the IBM Storage Solutions External Runtime Components (previously named “XPyV”) to version 1.4.4 to resolve man-in-the-middle (MITM) security attacks.
As always test, test, test and read the guide before implementing, especially if you are upgrading from version 1.1.1.
![]()
I came across a recent article by Marnix Wolf and S.Carrilho regarding a little known SQL setting known as Max Degree of Parallelism (MDoP)
When SQL Server runs on a computer with more than one microprocessor or CPU, it detects the best degree of parallelism, that is, the number of processors employed to run a single statement, for each parallel plan execution. You can use the max degree of parallelism option to limit the number of processors to use in parallel plan execution.
This becomes an issue on servers with hyper-thread enabled processors, as by the nature of hyper-threading the system thinks that there are more cores available then there physically are.
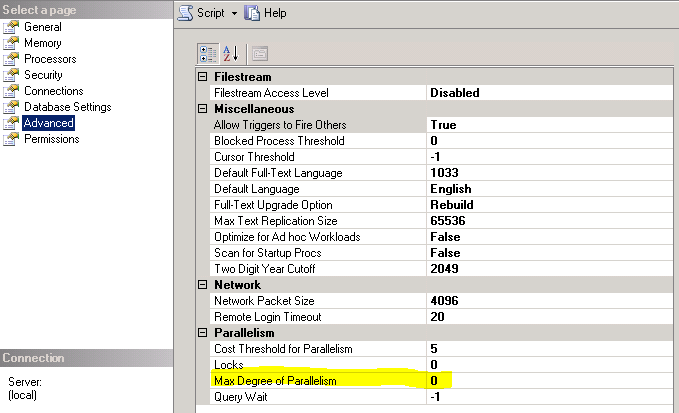
This setting can be found under SQL Server advanced properties:
In order to calculate the recommended value for this setting we need to use the MDoP calulator which makes use of two queries:
1. Output of following query from the SQL Server instance:
SELECT COUNT(DISTINCT memory_node_id) AS NUMA_Nodes FROM sys.dm_os_memory_clerks WHERE memory_node_id!=64
2. Launch Powershell and get the output of following PS command:
Get-WmiObject -namespace “root\CIMV2” -class Win32_Processor -Property NumberOfCores | select NumberOfCores
3. Input these value into the calculator:
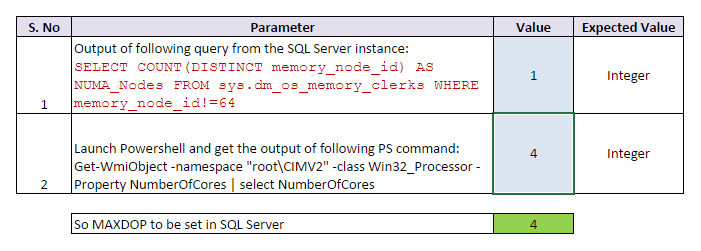
In this example the SQL query returned a value of 1 and the PS returned a count of 4 cores, the calculator recommends an MDoP setting of 4.
I’ve had situations in the past where no amount of tweaking seemed to improve console performance and this certainly a factor I will be taking into account in the future. Definitely give Marnixs’ article a read as he covers the topic in more detail with additional findings from his field experience.
There are other ways to improve console performance, I will combine them together in a future blog post about complete console tuning.
![]()
A new free eBook has been released about Extending Operations Manager Reporting, it is available for download here.
The System Center Operations Manager data warehouse stores many objects, making it
possible to report on performance, availability, configuration, and security. You can use data
collected by Operations Manager for issue tracking, awareness, planning, and forecasting, all of
which are important factors for maintaining and managing your environment. But
understanding what to report on and how to do so is what actually contributes to the stability
of your infrastructure. If you’re not using the data you collect about your environment, you’re
simply wasting space. If you use Operations Manager to monitor your environment, whether
your infrastructure or a public, private, or hybrid cloud, this book is a good resource to help
you understand the basics of reporting and how to build queries and stored procedures for
your reports. It can also help you understand the various elements of Operations Manager
management packs that are used when you create reports.
This book assumes that you have a good understanding of Operations Manager and the
management pack structure required to create custom reports. It also assumes that you have a
good working knowledge of SQL Server and tools like Report Builder, Business Intelligence
Development Suite, and SQL Server Data Tools.
![]()
Microsoft has released an updated System Center 2012 Management Pack for Microsoft Windows Server File & iSCSI Services 2012 it is now on version 7.1.10100.0 and is available for download here.
System Center 2012 Management Pack for Microsoft Windows Server File & iSCSI Services 2012. This version of Management Pack for File Server 2012 includes the following changes:
![]()
Microsoft has recently released a new update rollup for SCOM 2012 SP1, it’s good to see that they are continuing support for the clients that havent migrated to R2 yet.
The update is available for download here and fixes the following issues:
![]()
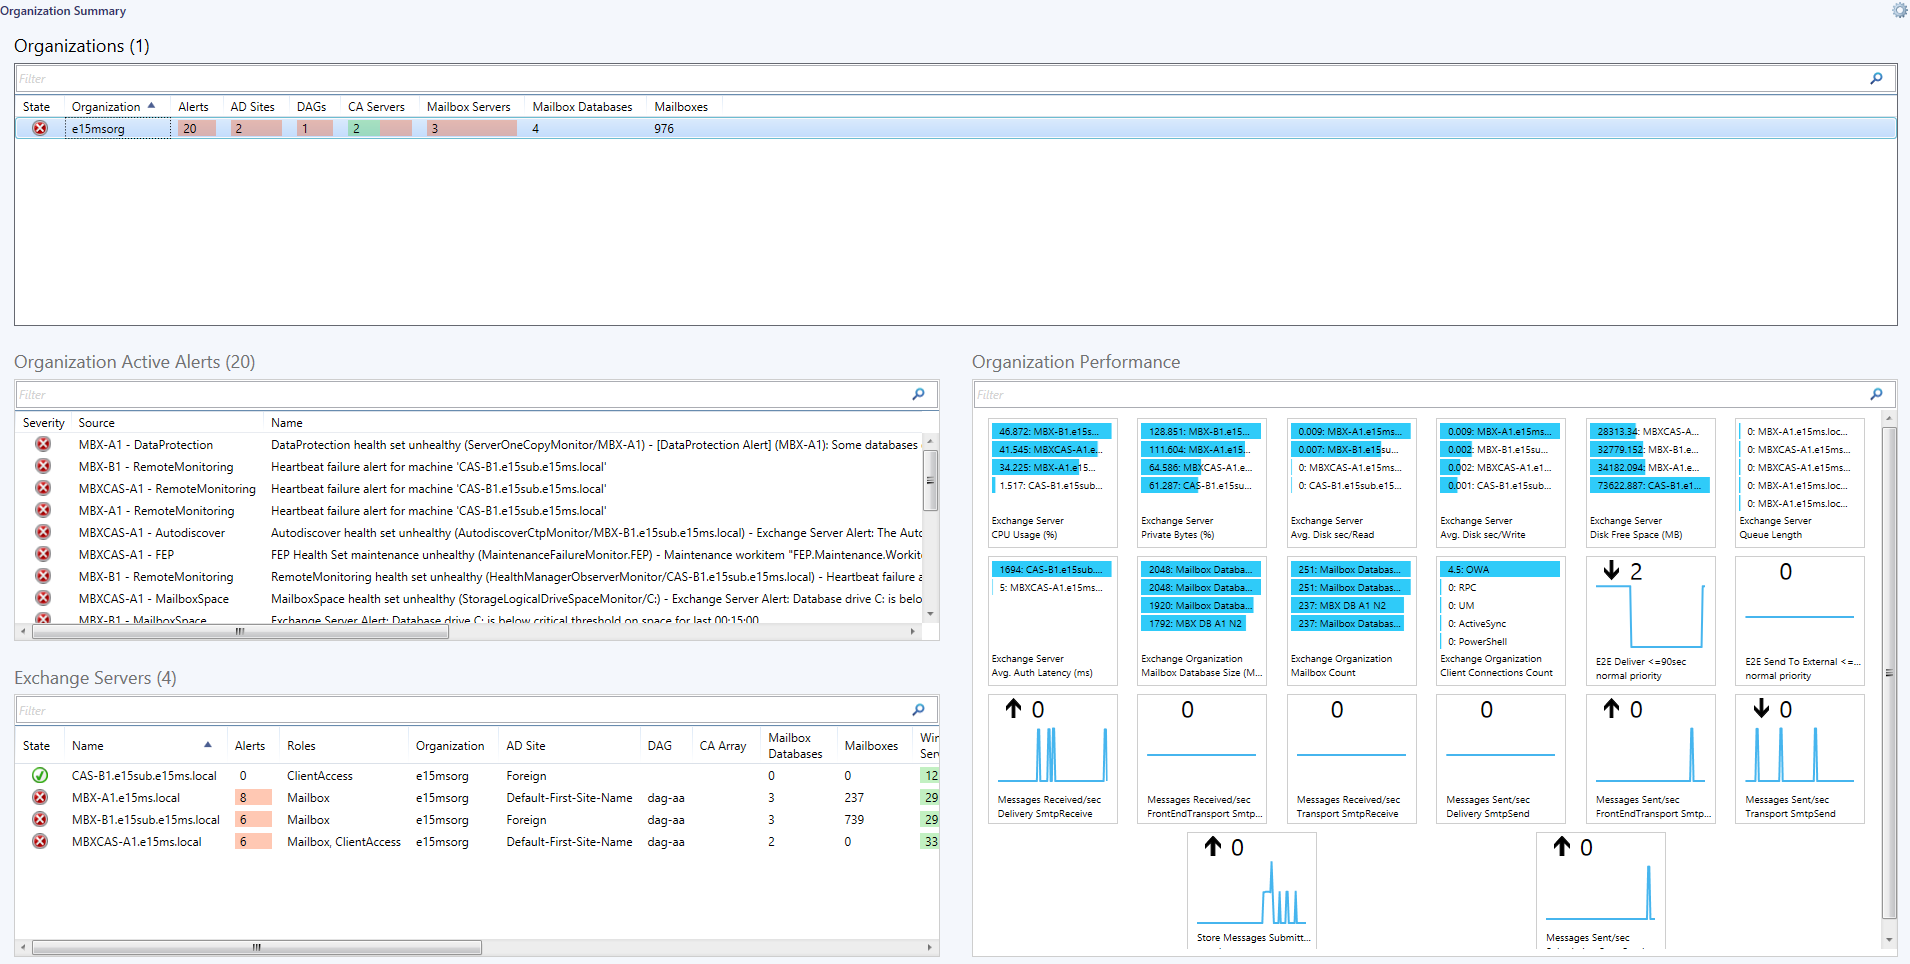
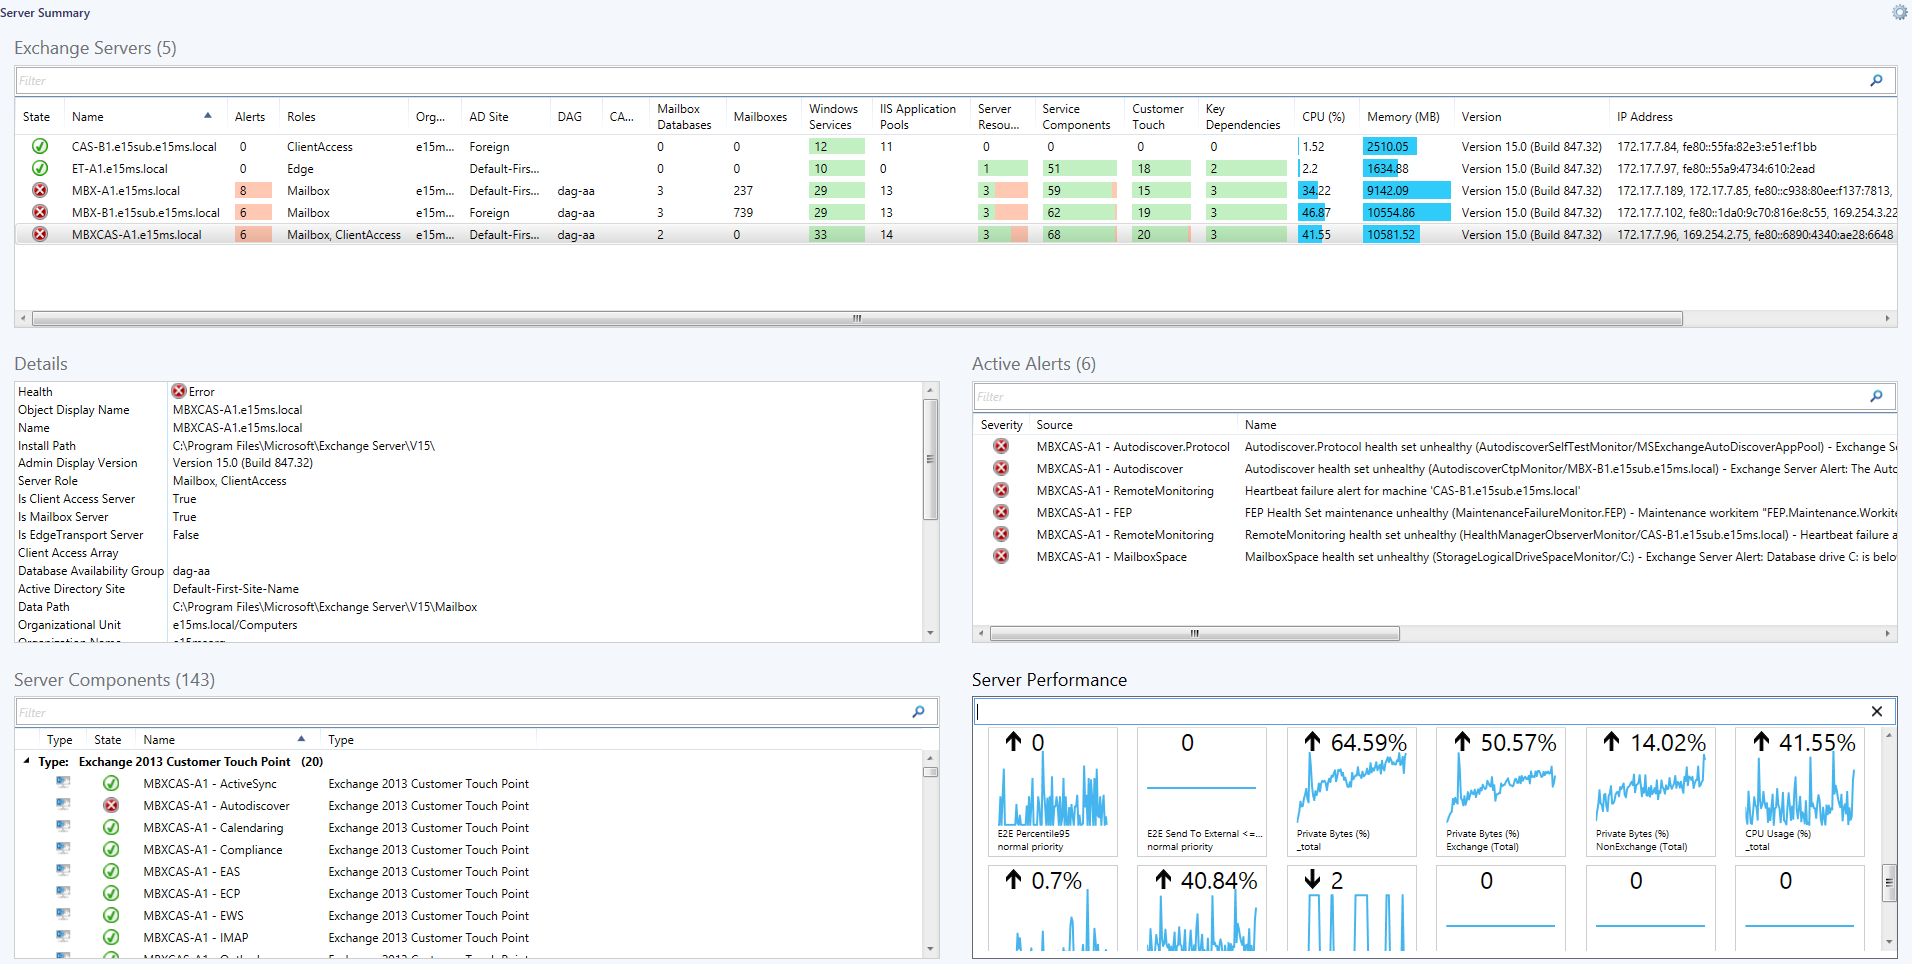
The original version of the Exchange 2013 Management pack was quite feature poor and didn’t have any performance collection. It’s great to see that Microsoft is listening to the needs of its customers and has added features and generally improved this management pack over all.
The new version is available for download here.
Version 15.0.652.19 includes performance collection rules which were missing from the previous version as well as new views, group, dashboard and reporting.
The performance collections rules that are now included are listed below, as extracted from the MP guide:
Exchange 2013 Server
o Exchange 2013 Database: I/O Database Reads Average Latency (ms)
o Exchange 2013 Database: I/O Database Writes Average Latency (ms)
o Exchange 2013 Database: I/O Log Reads Average Latency (ms)
o Exchange 2013 Database: I/O Log Writes Average Latency (ms)
o Exchange 2013 Database: Page Fault Stalls/sec
o Exchange 2013 Server: Average Disk sec/Read
o Exchange 2013 Server: Average Disk sec/Write
o Exchange 2013 Server: Disk Free Space (MB)
o Exchange 2013 Server: Disk Reads/sec
o Exchange 2013 Server: Disk Size (MB)
o Exchange 2013 Server: Disk Writes/sec
o Exchange 2013 Server: Transport Queue Database Size (MB)
o Exchange 2013 Server: Client Connections Count
o Exchange 2013 Server: ActiveSync Pending
o Exchange 2013 Server: Avg. Authentication Latency (ms)
o Exchange 2013 Server: E2E Deliver <=90sec
o Exchange 2013 Server: E2E Latency Percentile 95
o Exchange 2013 Server: E2E Latency Send to External <=90sec
o Exchange 2013 Server: EWS Response Time (ms)
o Exchange 2013 Server: LDAP Search Time (ms)
o Exchange 2013 Server: Messages Received/sec
o Exchange 2013 Server: Messages Sent/sec
o Exchange 2013 Server: Outstanding Proxy Requests
o Exchange 2013 Server: HTTP Proxy Failure Rate (%)
o Exchange 2013 Server: HTTP Proxy Requests/sec
o Exchange 2013 Server: Queues by Type Count
o Exchange 2013 Server: Queue Length
o Exchange 2013 Server: Requests/sec
o Exchange 2013 Server: Avg RPC Latency (ms)
o Exchange 2013 Server: SMTP Bytes Received/Sec
o Exchange 2013 Server: SMTP Bytes Sent/Sec
o Exchange 2013 Server: SMTP Connections (Current)
o Exchange 2013 Server: Store Messages Submitted/sec
o Exchange 2013 Server: System Total Memory (MB)
o Exchange 2013 Server: CPU Utilization (%)
o Exchange 2013 Server: Private Memory Size (MB)
o Exchange 2013 Server: Private Memory Size (%)
Exchange 2013 Windows Service
o Exchange 2013 Windows Service: CPU Utilization (%)
o Exchange 2013 Windows Service: Pool Non Paged Memory Size (MB)
o Exchange 2013 Windows Service: Pool Paged Memory Size (MB)
o Exchange 2013 Windows Service: Private Memory Size (MB)
o Exchange 2013 Windows Service: Private Memory Size (%)
Exchange 2013 IIS Application Pool
o Exchange 2013 IIS App Pool: Active Requests
o Exchange 2013 IIS App Pool: Private Memory Size (%)
o Exchange 2013 IIS App Pool: CPU Utilization (%)
o Exchange 2013 IIS App Pool: Pool Non Paged Memory Size (MB)
o Exchange 2013 IIS App Pool: Pool Paged Memory Size (MB)
o Exchange 2013 IIS App Pool: Private Memory Size (MB)
Exchange 2013 Mailbox Database Copy
o Exchange 2013 Mailbox Database: Available Space (MB)
o Exchange 2013 Mailbox Database: Index Size (MB)
o Exchange 2013 Mailbox Database: I/O Database Reads Average Latency (ms)
o Exchange 2013 Mailbox Database: I/O Database Writes Average Latency (ms)
o Exchange 2013 Mailbox Database: I/O Log Reads Average Latency (ms)
o Exchange 2013 Mailbox Database: I/O Log Writes Average Latency (ms)
o Exchange 2013 Mailbox Database: Transaction Log Available Space (MB)
o Exchange 2013 Mailbox Database: Transaction Log Size (MB)
o Exchange 2013 Mailbox Database: Database Page Fault Stalls/sec
o Exchange 2013 Mailbox Database: Database Size (MB)
Exchange 2013 Organization
o Exchange 2013 Organization Synthetic: Mailbox Count
o Exchange 2013 Organization Synthetic: Client Connections Count
o Exchange 2013 Organization Synthetic: E2E Deliver <=90sec
o Exchange 2013 Organization Synthetic: E2E Latency Send to External <=90sec
o Exchange 2013 Organization Synthetic: Mailbox Database Size (MB)
o Exchange 2013 Organization Synthetic: Messages Received/sec
o Exchange 2013 Organization Synthetic: Messages Sent/sec
o Exchange 2013 Organization Synthetic: Store Messages Submitted/sec
The new dashboards look to be quite useful containing an Organisational Overview and Server overview, which should be useful to the support team. I hope this is an example of the type of content we can expect to see in future management packs.
![]()