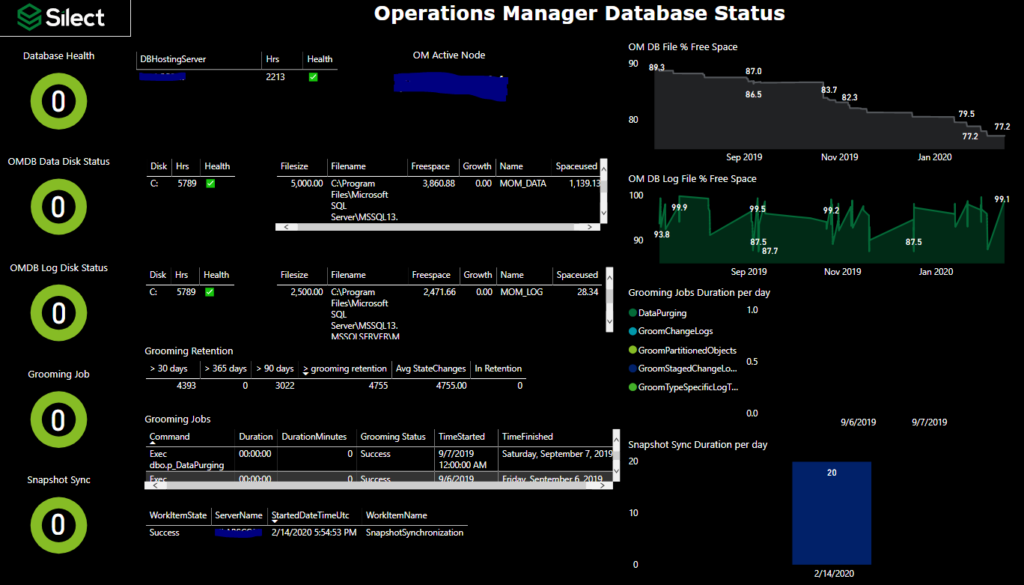
Silect has released an awesome set of dashboards for SCOM and best of all they’re free. You can request your copy here.
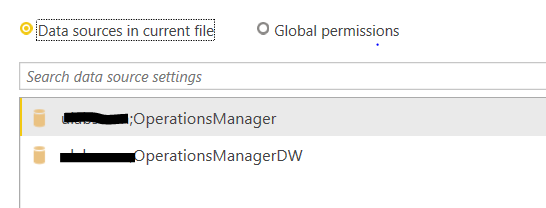
All you need to get started is PowerBI Desktop available here, then load the pbix file and edit the data source to point at your SCOM database instances.
Then hit refresh and you’ll have 10 nice health dashboards with an overview of your SCOM environment.
I really like this solution, it’s elegant and easy to setup. Great job Silect.
The much anticipated release of UR1 for SCOM 2019 is here and you can get it from the update catalog.
There’s quite a bit to unpack here so lets have a look
The big changes are of course support for gMSA which I for one have been looking forward to for a while. The security benefits are obvious and I can say while it does work well be aware that it is complex to implement so read those instructions thoroughly.
The one click upgrade experience is also a step in the right direction making things much simpler for the SCOM admin, just note it only includes the server update so you will still need to upgrade your console, reporting etc manually.
See below for a complete list of all the changes
Improvements and issues that are fixed
Web Console Fixes/Changes:
State widget now supports sorting by health and age.
Alert widgets can now be searched on Date Time and sorted based upon age and severity.
The alert link in email notification when browsed throws an error, “Your session with the Web Console server expired” even though the user was not logged in web console . You will now see the login page post this fix.
Alert summary view in SCOM Web console was fixed in size. This can be expanded as required now.
When Alert state is changed to some custom state, then these alerts are not displayed in web console. Alerts with custom resolution states will be displayed now.
Few additional scrollbars appear when a customer widget is created in web console or browser window size is reduced.
Improvement: SCOM views will load/save much faster than before.
Unix/Linux/Network Monitoring Fixes/Changes:
SCX by default does Info level logging which causes SCX logs to be filled up soon. With 2019 UR1, Warnings and Errors will be logged by default not Info.
In the network device monitoring, if the node property is changed to null/empty, it displays the old value of the property not the null value. The actual value will be displayed now which includes null.
In a scenario where multiple (~500) virtual network interfaces are running on agent, SCOM sometimes received heartbeat failure alerts for such agents. SCOM will monitor only physical interfaces hosted on these machines. For monitoring virtual interfaces, you need to set “enumvif” to true.
SNMP GET or SNMP WALK resulted monitoring host to crash when the network object ID is equal to ULONG Max. There is an error with event ID 4000 due to this crash.
For linux distros servers, when the kernel version >= 4.18, then file system related performance data is shown as 0 in SCOM. This is fixed in FS provider to make it kernel version agnostic and collect file system stat info.
Use of Async Windows Management Infrastructure (MI) APIs is default functionality from SCOM 2019 UR1 for scalability improvements.More details here.
Admin Console Fixes:
When admin created “one-time maintenance mode schedule” for non-English locales, SCOM console displays an error “The client has been disconnected from the server. Please call ManagementGroup.Reconnect() to reestablish the connection”. Admin would be able to create one-time maintenance schedule now.
When SCOM agent is multihomed, then SCOM 2019 MS always displays logon type as “Interactive” for this agent. The correct logon type will be displayed now.
Unit monitor to check correct logon type for Run as Account had incorrect name and Operational State.
“Operations Manager Products” view in Admin console did not update the “Version” column for the installed component version. This column will now reflect the updated version of all the components listed.
Others:
When system proxy is configured on the Reporting Server; proxy overrides are ignored by the “Report Console Watcher Monitor” and “Web Console Watcher Monitor” and as a result HTTP/HTTPS access fails. With UR1 fix, “Set proxy Direct” parameter of the mentioned monitors can be set to true and URLs will be accessed.
SCOM did not discover Windows Cluster which are deployed on servers with IPV6 network only enabled. IPV6 network will be supported for cluster monitoring now.
When the Domain controller is moved to a different AD site, then SCOM does not display the correct site name. Any dynamic group which are created for SiteName will also fail
In addition to these, all the issues fixed in SCOM 2016 UR8 and prior UR for SCOM 2016 are also fixed in SCOM 2019 UR1. Details of the fixes are below.
In a scenario where SCOM monitors 100s of virtual machines hosted on a single Hyper-v server; every hour the healthservice.exe of each Virtual machine write into the VM page file simultaneously. Due to this concurrent paging, every hour disk I/O increases and database becomes unresponsive. HealthService.exe now have Memory Trimming enabled by default on an hourly schedule. A registry key is provided to disable the memory trimming and control the duration.
Registry key is: “HKLM\Software\Microsoft\Microsoft Operations Manager\3.0\Setup\MemoryTrimming”
Enable – 0 (Trimming is disabled); 1 (trimming is enabled)
DelayInSeconds – Time period agent waits to start trimming (default is 120s)
PeriodInSeconds – Recurring period at which the working set should be trimmed (default is 3600s)
Historical data do not appear, if input reporting end time is before group creation time. With this fix, historic data for a group (if data is available for objects in the group) would be displayed irrespective of group creation time.
Maintenance mode state changes which are recorded in MaintenanceModeStage table requires grooming when table grows. If the table is large, grooming takes longer and the operation times out with SQLTimeOut exception.
If a group is renamed in a Management pack, then console shows the new value but Powershell command Get-SCOMGroup returns the old name of group. Database Updates functionality was inconsistent for SCOM group renaming through MP and SCOM Console.
CPU Spike issues because of workflows running on all agents at the same time is addressed through script optimization and removing the sync time.
Improvement: Sometimes SQL stored procedure “p_SelectForNewTypeCache” takes long time to complete, and SDK service fails to start. This is fixed and above SQL stored procedure will complete faster now.
Improved the performance of SCOM console in listing the groups.
Users of a scoped group are not able to use the Console.
SCOM console crashes while trying to connect to Azure Log Analytics and Azure Monitor.
SCOM Network Device Re-Discovery now probes for SNMP V3 devices too.
Agents by Health State report shows duplicate agent names.
Fixed an issue that prevented addition of a group in the Storage Spaces Direct 2016 management pack dashboard.
Linux agent is not able to get the correct version and port details for JBoss EAP 7.1.
An issue that lead to creation of multiple empty temp files in the /tmp directory of Linux servers has been fixed.
Fixed the formatting issue with the output for the task ‘Top10 CPU Processes’ when using Windows Management Infrastructure (MI) APIs.
Fixed an issue that caused the corruption of /etc/login.cfg file on AIX 7 machines during install/upgrade of the agent.
AIX Agent is now transitioned to 64-bit package to accommodate more stack and heap space if needed to avoid any stack/heap overflow which occasionally leads to heartbeat failure.
Free memory calculation accommodated appropriately on RHEL-7 platform.
The great crew over at OpsLogix has a new Oracle MP for us to ring in 2020, it’s available here
What’s different?
Changes
Rewritten the complete backend to make usage of a collector service. This way we detach the SCOM modules from the Oracle client resulting in a way less footprint and more performance.
Moved the Oracle configuration dashboard from monitoring pane to Administration pane.
Rewritten the Oracle configuration dashboard. Please read documentation how to use.
Added Opslogix General Reports MP to the install package.
The container DB discovery is now by default disabled.
Fixes
The connection monitor now only reports an error when it is x times (2 default) in unhealthy state.
When creating a connection alert a parameter could not be resolved for the alert description.
During getting sysstats information with containing very big numbers the converting to SCOM data could be broken
This year at Ignite SCOM had it’s own dedicated session which is great to see. Here is a summary of the new upcoming features in UR1.
Version Agnostic Management Packs Storage Spaces Direct (S2D) MP RHEL 8 Support One click patching experience Support for gMSA Relability and Performance Improvemennts for Linux Agent Common Management Pack for Linux Resource Group monitoring in Azure MP Azure MP Web Console Dashboards
The ones I’m most looking forward to are of course the support for gMSA, with security being so critical in today’s IT real-estate this features adds an additional layer of peace of mind to your SCOM monitoring.
The one click patching experience is also a nice quality of life improvement, I had the privilege to see this in action and I like the direction this is going.
More agnostic management packs are also on the way which will simplify administration of products the same way we’ve seen them improve the SQL monitoring experience.
Adding parameters to a workbook allows you to change values in your queries such as workspace without having to manually edit the query. This makes workbooks much easier to use and widens the potential audience.
Lets look at how to add parameters, some common ones and a little cheat sheet I use to quickly start a new workbook.
Adding Parameters
Parameters can be added into a KQL query by including the parameter name in braces, for example if I have a parameter for Time I can reference it in my KQL query as {Time}
There are currently four different supported parameters:
Text – An editable text box Drop Down – Choose from a defined set of values Time Range Picker – Choose from a predefined set of time range values Resource Picker – Choose from resources selected for the workbook
Example Parameters for our Quick Start Template
Time
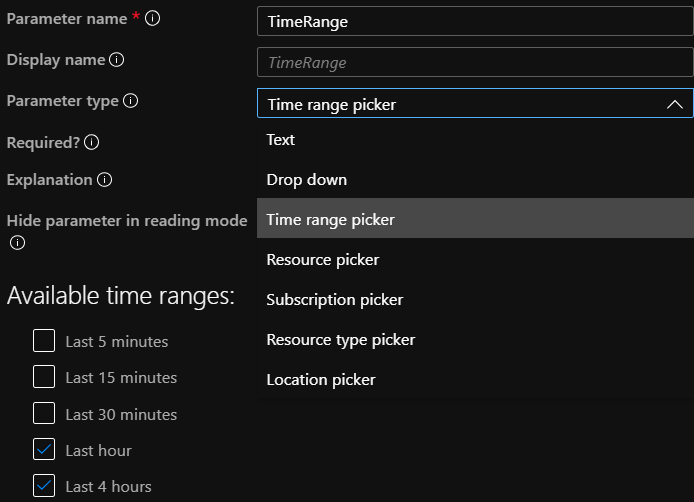
Adding a time parameter is relatively straight forward as it is a pre-defined parameter type, click add parameter and give it a name, select Time range picker from the type field and select the times ranges you want to be available. Then click Save
Subscription
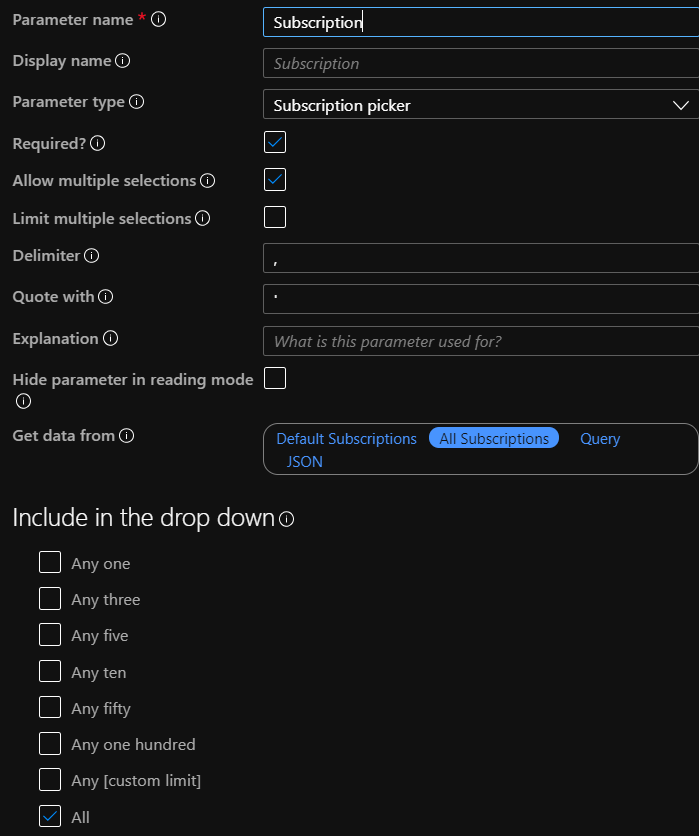
Adding a subscription parameter is very useful as it allows your workbook to be able to query across subscriptions easily. After giving the parameter a name, choose Subscription picker from the type. Tick Allow multiple selection and also include the All option below then you can select from Default Subscriptions and All Subscriptions. Then click save.
Workspace
Workspace is useful for the same reasons Subscription is, this will allow a workbook to easily query across multiple workspaces from a single location.
This one is a little more complex to configure as it you’ll need to reference the workspaces through a KQL query, there are several ways to do this and i’ll share the one I am currently using.
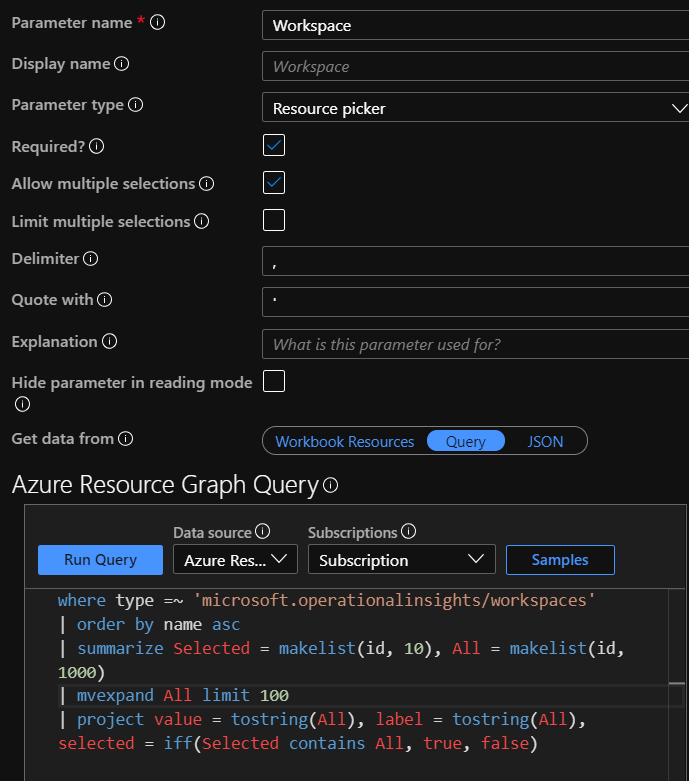
As before name your parameter, this time choose Resource picker, allow multiple selection and All as options and then select Get data from Query, set your source to Azure Resource Graph and Subscription, the query I use is below:
where type =~ ‘microsoft.operationalinsights/workspaces’ | order by name asc | summarize Selected = makelist(id, 10), All = makelist(id, 1000) | mvexpand All limit 100 | project value = tostring(All), label = tostring(All), selected = iff(Selected contains All, true, false)
Servers
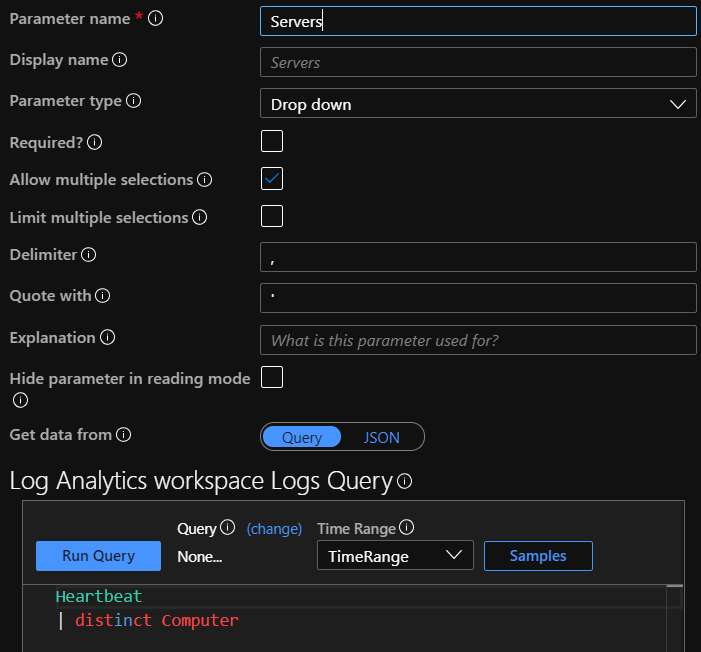
Not all Workbooks will require Servers but I use it often enough that I include in my Quick Start Template. This time choose Drop down, as before allow Multiple selection and All. We are going to populate our list from a query and a simple way to get a list of Servers is:
Heartbeat | distinct Computer
Once you have saved this workbook with your populated parameters it is now a simple matter to reuse this every time we want to create a new workbook with parameters. All you need to do is edit this one and Save As to start a fresh workbook with pre-done parameters.
Json Template
Below is the template to create your own easy quick start workbook, just create a blank one and paste the json code into the Advanced Editor in the Gallery Template section and click apply.