I encountered a minor issue today which luckily proved simple to solve. Hopefully this proves useful to others.
The Issue:
In a brand new SCOM 2019 deployment the scheduled reports weren’t sending. After investigation I found the below error in the Application log on the SSRS server:
SQL Server Scheduled Job ’62A9826E-082B-4ACD-9270-6BC13FC260BE’ (0x832F33183531EF4483665BBBFCCEBD9A) – Status: Failed – Invoked on: 2020-08-05 11:00:00 – Message: The job failed. Unable to determine if the owner (DOMAIN\USER) of job 62A9826E-082B-4ACD-9270-6BC13FC260BE has server access (reason: Could not obtain information about Windows NT group/user ‘DOMAIN\USER’, error code 0x5. [SQLSTATE 42000] (Error 15404)).
The Solution
The SSRS Instance, in this case SQL 2016 SP2, was deployed using system accounts for the SQL Server and SQL agent services. Simply changing these to use a domain account with access to the SQL instance resolved the issue and reports started sending shortly after.
It’s quite a common ask, as to how to take the data in an Azure Monitor Logs workspace and create a report that can then be scheduled. Lets take a look at how we can achieve that.
Immediately we are talking about automation when we use the word schedule and Azure has several tools which we can use. The best fit in this case is Logic Apps.
In this example we will create a report showing if any agents haven’t had a successful heartbeat in the past 24 hours.
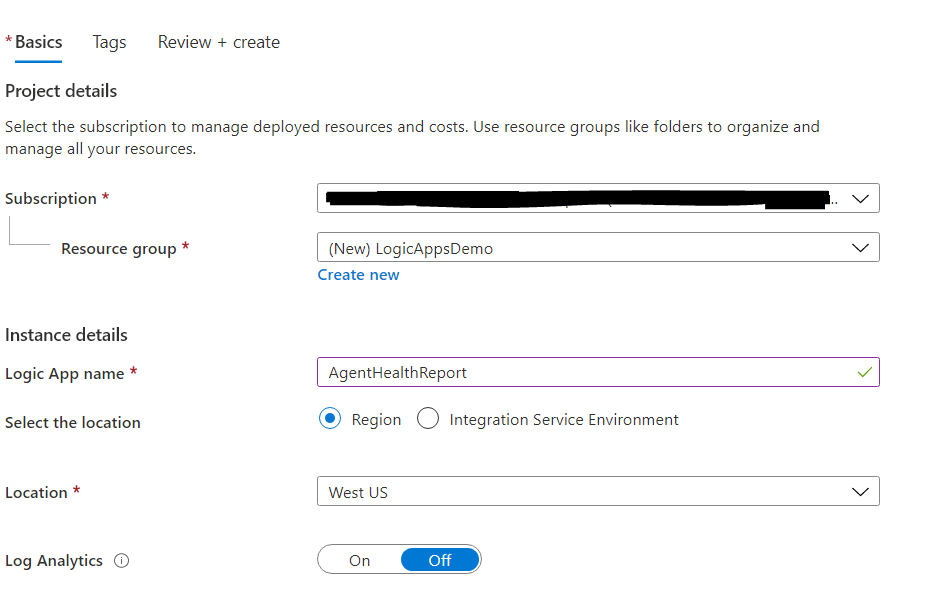
Navigate to the Logic Apps blade in your Azure Portal and click +Add
Populate the fields selecting my subscription and resource group, creating a new RG if necessary. Then I’ll give my logic app a name and choose my Azure region and click Review + Create and then Create
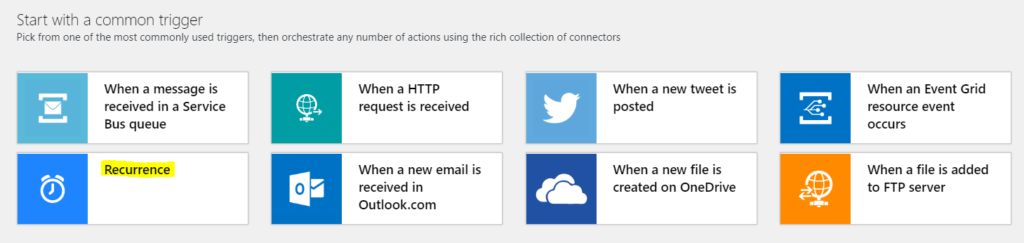
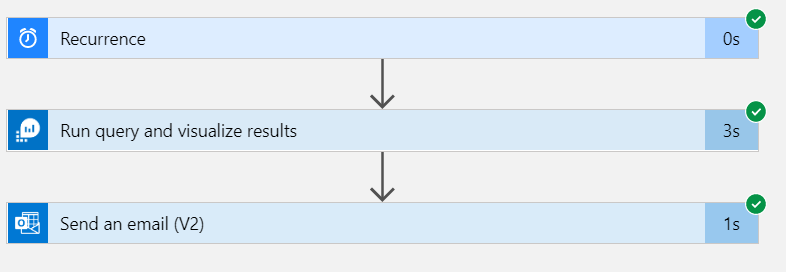
Once the deployment is complete I can navigate to the resource and it automatically opens the Logic Apps Designer. Now every Logic App needs to start with a trigger and because I want to run a schedule I am going to use Recurrence
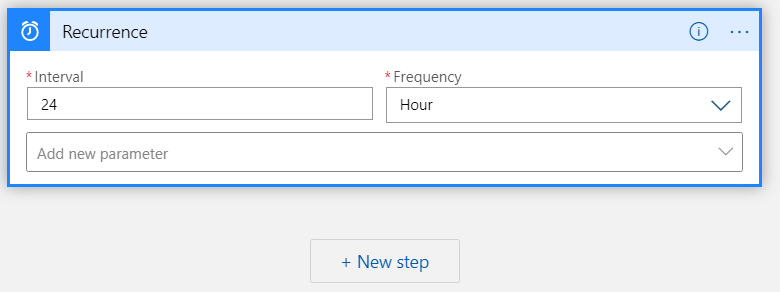
I want this on a daily basis so I’m going to enter 24 Hour as my parameters and then click new step
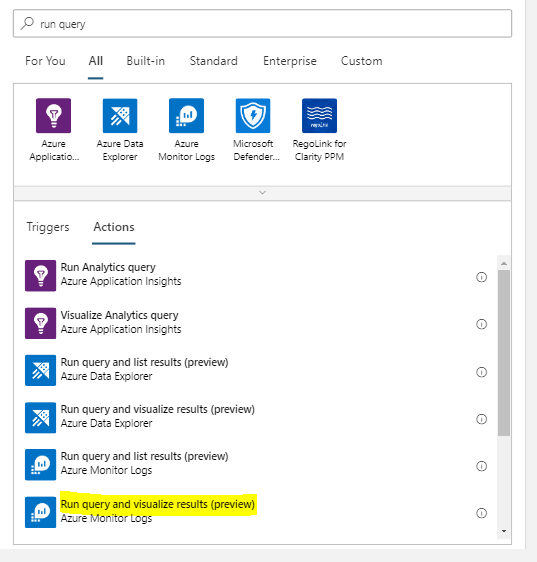
Search for Run Query and Visualize Results as this option will allow a KQL query as a parameter and the results can be manipulated in a variety of ways. Make sure to select the one for Azure Monitor Logs and not for Azure Data Explorer.
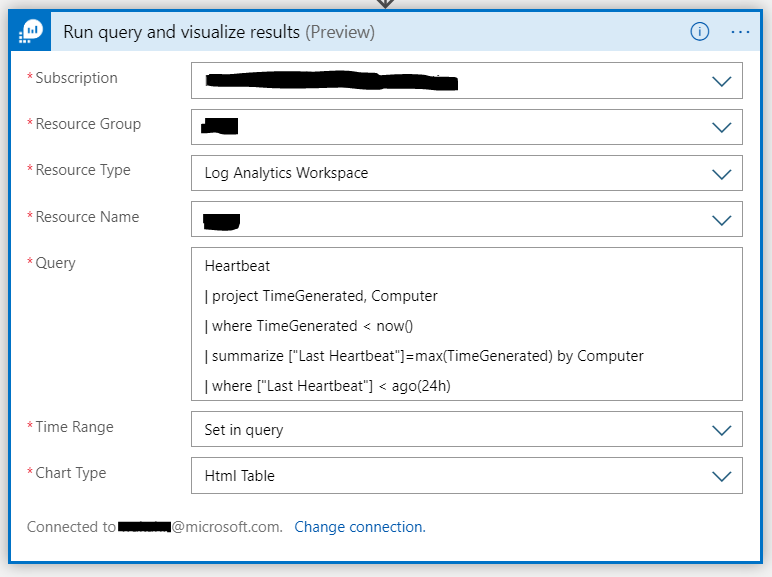
You will need to sign in to create a connection with Azure Monitor Logs. Now populate the fields choosing the subscription, resource group and workspace that contains the data you want to use in your report. Put your query in the relevant section and choose chart type HTML.
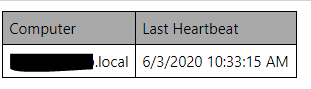
Heartbeat
| project TimeGenerated, Computer
| where TimeGenerated < now()
| summarize ["Last Heartbeat"]=max(TimeGenerated) by Computer
| where ["Last Heartbeat"] < ago(24h)
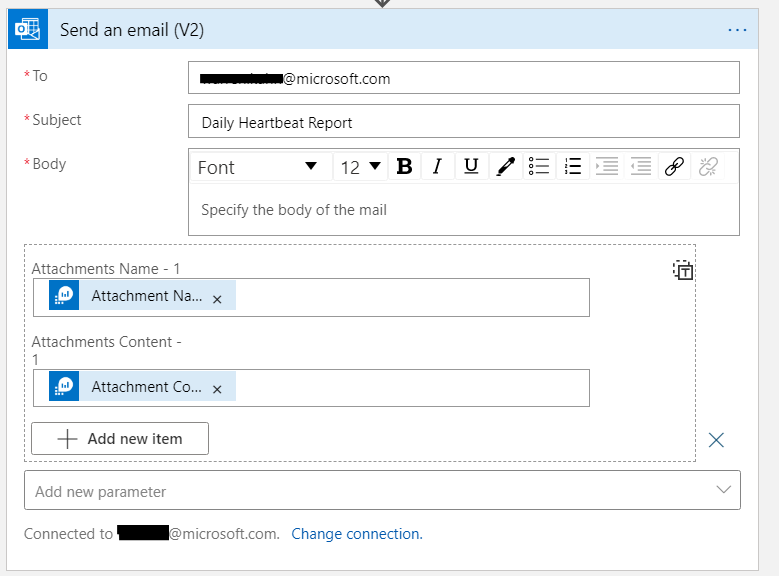
The last thing that needs to be done is connect the logic app to a step to send email, click New Step, search for send an email, I’ll be using Office365 but you can use other providers. Select Send an email v2 and sign in to create the connection.
Populate as below making sure to include the attachments
Click save and we’re all good to go. Now test by clicking Run.
You should receive an email with an attachment and voila opening it will have a nice html table with our query results.
These steps can be easily replicated and amended to be used for any number of handy reports using your Azure Monitor Logs data.