Sometimes you might have a situation where all of your agents are showing as healthy in the console but when you try and draw a performance report data is missing.
The below SQL query which has been developed by my colleague Gerrie Louw will identify any agent that has not submitted performance data in the past 4 hours. It does so by checking the following performance counters:
Processor > % Processor Time
LogicalDisk > % Free Space > C:
Memory > Available MBytes
Note: You will probably have to change the DisplayName_ and IsVirtualNode for your OperationsManager database.
if object_id(‘tempdb..#temptable’) IS NOT NULL
DROP TABLE #temptable
SELECT distinct bmetarget.Name into #temptable
FROM OperationsManager.dbo.BaseManagedEntity AS BMESource WITH (nolock) INNER JOIN
OperationsManager.dbo.Relationship AS R WITH (nolock) ON
R.SourceEntityId = BMESource.BaseManagedEntityId INNER JOIN
OperationsManager.dbo.BaseManagedEntity AS BMETarget WITH (nolock) ON
R.TargetEntityId = BMETarget.BaseManagedEntityId inner join mtv_computer d on bmetarget.name=d.[DisplayName_55270A70_AC47_C853_C617_236B0CFF9B4C]
and d.IsVirtualNode_E817D034_02E8_294C_3509_01CA25481689 is null
WHERE (bmetarget.fullname like ‘Microsoft.Windows.Computer%’)
if object_id(‘tempdb..#healthstate’) IS NOT NULL
DROP TABLE #healthstate
select megv.path, megv.ismanaged, megv.isavailable, megv.healthstate into #healthstate
from managedentitygenericview as megv with (nolock) inner join managedtypeview as mtv with (nolock)
on megv.monitoringclassid=mtv.id
where mtv.name =’microsoft.systemcenter.agent’
if object_id(‘tempdb..#perfcpudata’) IS NOT NULL
DROP TABLE #perfcpudata
select Path, ‘CPU’ as ‘Cat’ into #perfcpudata
from PerformanceDataAllView pdv with (NOLOCK)
inner join PerformanceCounterView pcv on pdv.performancesourceinternalid = pcv.performancesourceinternalid
inner join BaseManagedEntity bme on pcv.ManagedEntityId = bme.BaseManagedEntityId
where (TimeSampled < GETUTCDATE() AND TimeSampled > DATEADD(MINUTE,-240, GETUTCDATE()))
and objectname =’Processor’ and countername=’% Processor Time’
if object_id(‘tempdb..#perfmemdata’) IS NOT NULL
DROP TABLE #perfmemdata
select Path,’Memory’ as ‘Cat’ into #perfmemdata
from PerformanceDataAllView pdv with (NOLOCK)
inner join PerformanceCounterView pcv on pdv.performancesourceinternalid = pcv.performancesourceinternalid
inner join BaseManagedEntity bme on pcv.ManagedEntityId = bme.BaseManagedEntityId
where (TimeSampled < GETUTCDATE() AND TimeSampled > DATEADD(MINUTE,-240, GETUTCDATE()))
and objectname =’Memory’ and countername=’Available MBytes’
if object_id(‘tempdb..#perfdiskdata’) IS NOT NULL
DROP TABLE #perfdiskdata
select Path,’Disk’ as ‘Cat’ into #perfdiskdata
from PerformanceDataAllView pdv with (NOLOCK)
inner join PerformanceCounterView pcv on pdv.performancesourceinternalid = pcv.performancesourceinternalid
inner join BaseManagedEntity bme on pcv.ManagedEntityId = bme.BaseManagedEntityId
where (TimeSampled < GETUTCDATE() AND TimeSampled > DATEADD(MINUTE,-240, GETUTCDATE()))
and objectname =’LogicalDisk’ and countername=’% Free Space’ and instancename=’C:’
if object_id(‘tempdb..#temptable1′) IS NOT NULL
DROP TABLE #temptable1
create table #temptable1 (
name nvarchar(250),
cat nvarchar(20),
val nvarchar(2)
)
insert into #temptable1
select name, ‘CPU’ as ‘cat’, ’1′ as ‘val’
from #temptable where name not in
(select path from #perfcpudata)
insert into #temptable1
select name, ‘Memory’ as ‘cat’, ’1′ as ‘val’
from #temptable where name not in
(select path from #perfmemdata)
insert into #temptable1
select name, ‘Disk’ as ‘cat’, ’1′ as ‘val’
from #temptable where name not in
(select path from #perfdiskdata)
if object_id(‘tempdb..#output’) IS NOT NULL
DROP TABLE #output
create table #output (
name nvarchar(250),
cpu nvarchar(2),
memory nvarchar(2),
disk nvarchar(2)
)
insert into #output
select distinct tt.name ,’0′,’0′,’0′
from #temptable1 as tt, #healthstate as hs
where tt.name=hs.path collate SQL_Latin1_General_CP1_CI_AS
and hs.isavailable=1
and hs.ismanaged=1
and hs.healthstate is not null
update #output set cpu=1 where #output.name in (select name from #temptable1 where #temptable1.name=#output.name and #temptable1.cat=’CPU’)
update #output set memory=1 where #output.name in (select name from #temptable1 where #temptable1.name=#output.name and #temptable1.cat=’Memory’)
update #output set disk=1 where #output.name in (select name from #temptable1 where #temptable1.name=#output.name and #temptable1.cat=’Disk’)
select * from #output
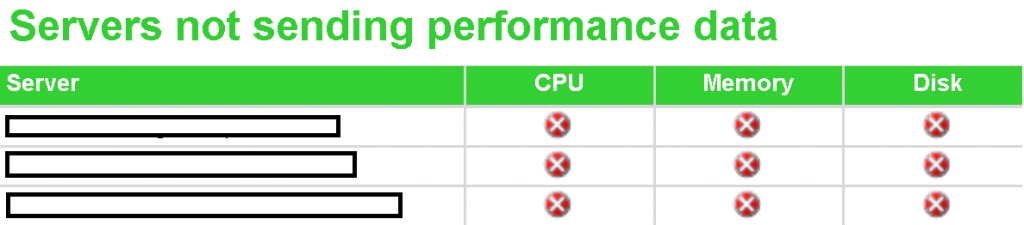
You can use this query to build a report such as the one sampled below:
With the 6.4.1.0 version of the SQL management pack the SQL 2012 DB Engine group does not contain all SQL 2012 servers. This is due to the group being populated based on a SQL registry key which is looking for a version value of 11.0.xxxx.x, however when updating SQL 2012 to SP1 the version changes to 11.1.xxx.x
Kevin Holman has written a nice blog entry about this particular issue: here. As well as an addendum management pack that contains a new group population discovery set to “11.*” along with an override to disable the built in group, which is available for download at the bottom of his article.
An oldie but a goodie, the below SQL script will help with investigating if a server was placed into maintenance mode and if so by whom. Just change %computer:% to the name of the specific device you are investigating and the StartDateTime as required.
USE OperationsManagerDW go SELECT DISTINCT MngE.DisplayName AS ServerName, MM.StartDateTime, MM.EndDateTime, MM.PlannedMaintenanceInd AS [PlannedMaintenance_1Yes-0No], MM.DWLastModifiedDateTime, MMH.Comment, MMH.UserId FROM OperationsManagerDW.dbo.vMaintenanceMode AS MM INNER JOIN OperationsManagerDW.dbo.vMaintenanceModeHistory AS MMH ON MMH.MaintenanceModeRowId = MM.MaintenanceModeRowId INNER JOIN OperationsManagerDW.dbo.vManagedEntity AS MngE ON MngE.ManagedEntityRowId = MM.ManagedEntityRowId WHERE MngE.FullName LIKE ‘%computer:%’ AND (MM.StartDateTime > ‘2014-03-01’) ORDER BY MM.DWLastModifiedDateTime
When updating the IBM Storage Management Pack to 2.1.0 there are a few things to be aware of, most of which is included in the documentation.
After completing the installation, running the upgrade configuration and removing the old management packs and importing the new ones we still weren’t able to re-discover the IBM SAN.
The documentation recommends, in the configuration section that, “The IBM storage configuration must be synchronized with Management Server manually if there is storage configuration left after upgrading from previous version to version 2.1.0. The IBM storage configuration also should be synchronized with the Management Server manually after the management pack is deleted and re-imported.”
Except that the command skipped all of our SANs.
Checking the SCOM configuration revealed that something which shouldn’t have happened, had happened. The SCOM configuration had been lost during the upgrade
Using the –sc-set command to re-do the configration was successful, which allowed the migration to complete and in short order the SANs were discovered and monitoring.
Something I’ve noticed, being exposed to a variety of SCOM deployments, is that in quite a few cases Management Packs are installed and never looked at again. Generally this seems to stem from either the engineer looking after the environment doesn’t know any better or is perhaps too cautious to perform an update but there may be other specific reasons such as client restrictions.
Never the less it is good practice to check all of your management packs regularly, I’d say at least once a month, to see if any updated versions are available.
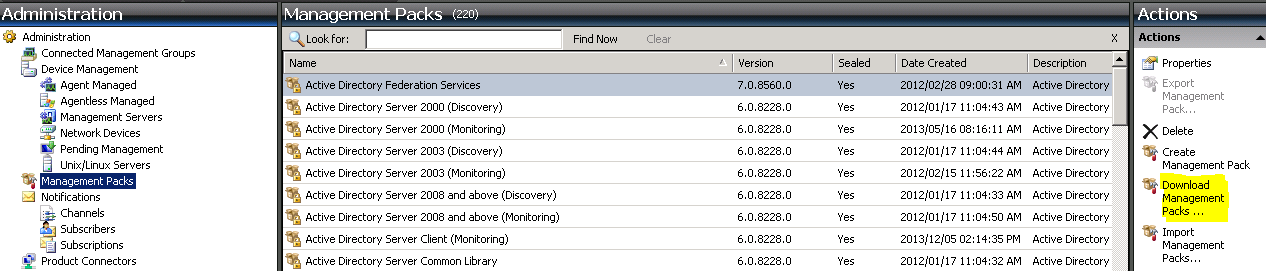
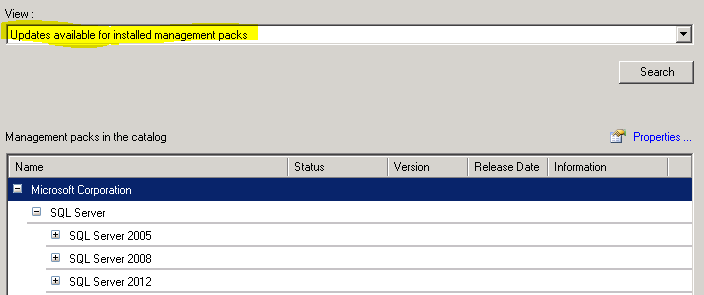
The easiest way to check MPs available through the catalog is to use the wizard in the SCOM console and search for “Updates Available for installed Management Packs”
In my experience once you have found a new version of a particular MP has been released it is always a good idea to download the MSI from the relevant site instead of using the wizard. This is because if a new management pack has been added to the package that wasn’t there in the previous version then you will not detect it as an update for an installed Management Pack.
If you have management packs not available through the catalog then they unfortunately need to be checked against the latest version at the vendor site manually.
Remember: If possible always test before deploying a new version of a management pack, if you don’t have access to a lab then an alternative is to keep an eye on community blogs and sites like System Center Central and MP Wiki, to see if any issues crop up.
If you have a good method for keeping your management packs up to date leave a comment.
Here is a great article on using the “Sync time” property correctly in SCOM overrides and workflows, written by Kevin Holman, follow the link for the complete article. On a side note it’s good to see Kevin back in the saddle as a PFE for SCOM. I’m sure we’re all looking forward to what wizardry he comes up with.
“We use the scheduler datasource in SCOM for workflows for all kinds of purposes. Most workflows have some concept of a schedule in the datasource to tell how often to inspect for something, like a service running, or to look at perfmon data, or to run a script.
The most common property would be the Interval, which is how often we want the workflow to run.
Just a quick note on the new AD management pack that was released with the 2012 R2 wave.
I noticed when using the console to check management pack versions and selecting “Show me updates for management packs I currently have installed” that the 6.0.8228.0 version of the AD management pack does not appear. This particular environment was SCOM 2007 R2 CU6
Has anyone else experienced this? Leave a comment.
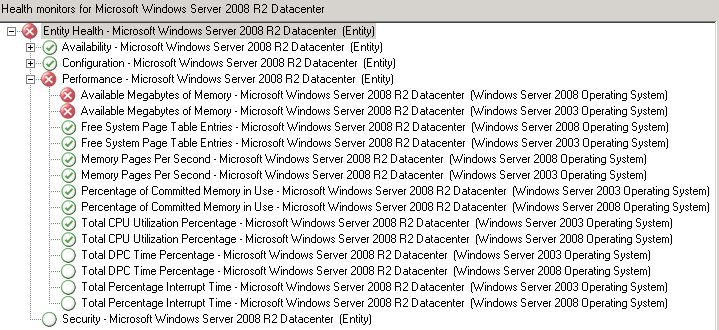
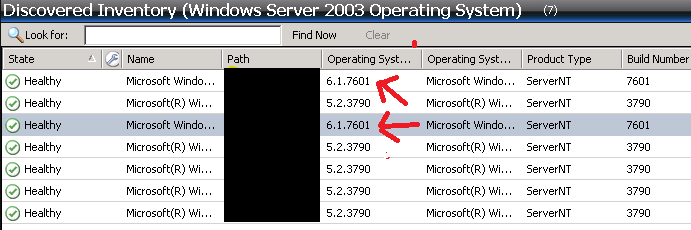
Now here’s something you certainly don;t see every day. It all started when I was asked to investigate a flood of memory alerts for a particular server at one of my customers. When I opened Health Explorer I noticed the following:
The server was running the monitors for Windows 2008 and Windows 2003.
As it turns out the server had been recently re-installed from 2003 to 2008 with the same name, without the agent being uninstalled or being removed from the console. This caused a bit of confusion in the back-end. A quick look at the Windows Server 2003 Operating System Inventory showed another server which was “Upgraded” i in the same fashion:
What’s happened here is the class for Windows Server 2003 Operating System is still being loaded by the agent, and this is causing all of the related rules and monitors to load as well. In the past when I’ve come across this particular issue I’ve been able to solve it with the remove-disabledmonitoringobject powershell cmdlet.
All that you need to do is override the discovery rule in question to false for your object (In this case “Discover Windows Server 2003 Operating System) and then open OpsMgr Shell and run remove-disabledmonitoringobject. After a short delay the offending objects are removed.
However in this case the above did not work, eventually I deleted the agent from the console, waited for grooming to run (you can force it if you are in a hurry), cleared the local agent cache and then approved the agent. Now only the correct objects are being discovered.
Jalasoft has released a new version of it’s Xian Wings product, which allows SCOM information such as graphs, alerts and states to be viewed on SmartPhone and Tablet Devices.
No more running back to the office when your network beckons you. With Xian Wings for Microsoft System Center Operations Manager 2007 and 2012 (Operations Manager) you have a real client application for your smartphone, which means states, alerts, performance graphs, and more are always at your fingertips. Perform any task—from anywhere.
Features:
Just like with your Operations Manager console, Xian Wings lets you have a states-view to see the health of the objects you want to monitor.
Check the alerts of a specific object or see all the alerts that are currently active—right form your smartphone. Plus, you can easily filter or limit the number of alerts forwarded to your mobile devices so you only see what you need. You can even view and change alert properties in real time, right from your phone. No more being tied to your Operations Manager console.
How’s your network performing? You’ll always know. Xian Wings lets you see performance graphs on your smartphone too. Just select the object and the counters you want to view and you’ll get the corresponding graph. Xian Wings even stores the latest graphs you made automatically so you can quickly retrieve them with a couple of taps.
Whether you need to obtain memory usage information, IP configuration, or respond to an event that you would normally respond to, Xian Wings lets you do the tasks you need to do from your smartphone. It is up to you to create even more Operations Manager tasks to execute while you are out of the office.
Want the most important alerts the moment they occur? Xian Wings gives you the option to set up notifications, too. It’s simple. No need to synchronize Xian Wings—you’ll be notified of important alerts automatically.
Especially for iPad, there is Wings HD. This version offers all the features of Wings but adjusted for tablets. You have the ability to create your own dashboards with graphs, states, alerts, a click on any object will open an object related screen that gives you the direct ability to see the root cause of the problem and take actions. It is now possible to run power shell and prompt commands directly from your iPad against the OpsMgr server or another computer. And besides alerts, states and performance graphs, it is possible to add a notifications widgets to any Wings dashboard. Wings HD is the best mobile dashboard you can wish for Operations Manager