Category Archives: SCOM 2012 R2

SCOM: Alerting when a server is up for more than X days

If you ever need to alert if a server has been online for more then a specific time period, you can achieve this with the following method. In this example we will be alerting if the server is up for more than 60 days.

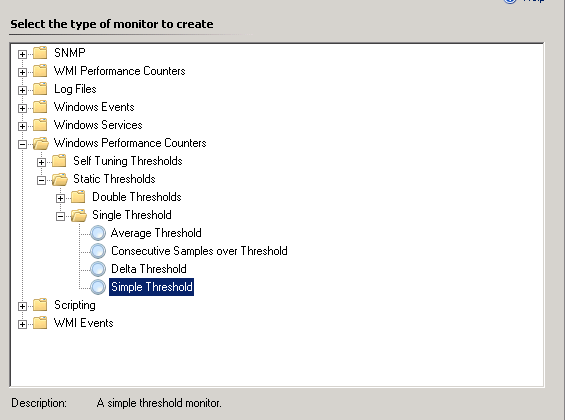
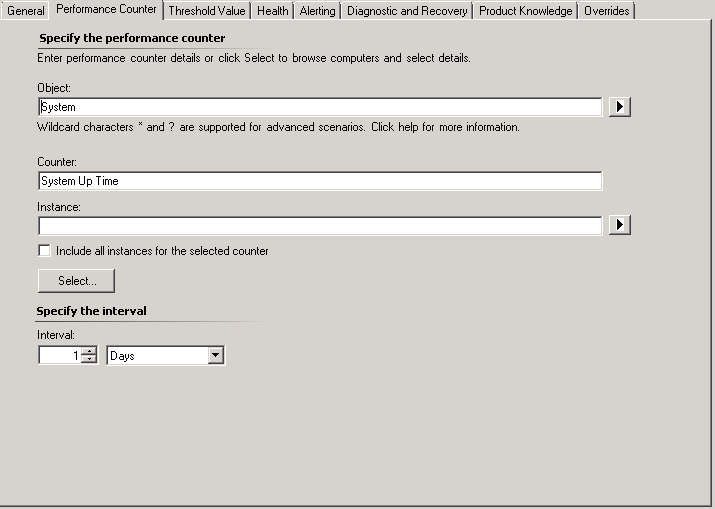
Firstly create a unit monitor >  Windows Performance Counter < Single Threshold > Simple Threshold, targeting a relevant target, in this case we used Windows Computer.

41

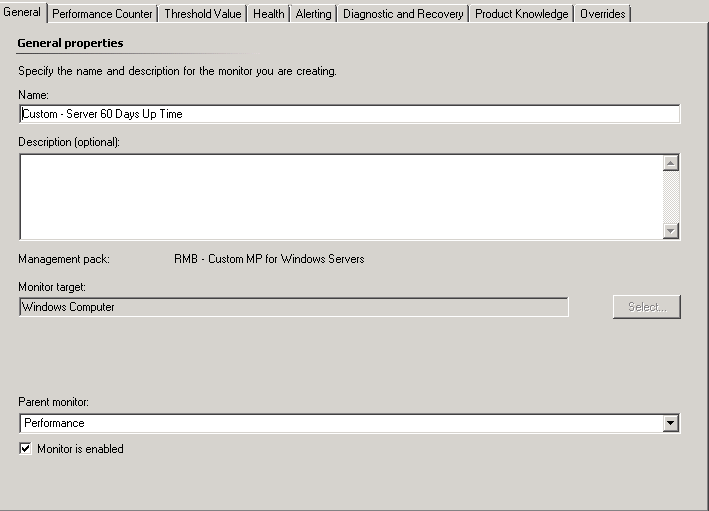
Then specify the performance counter to target the System Up Time Counter which is part of the System Object,

2

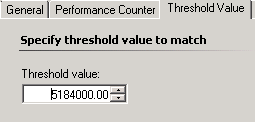
The threshold value is in seconds and needs to be set according to your requirement, in our case 60 days is 5184000 seconds.

3

You can then leave the alert details as is or specify a custom message. You will now get an alert for any server that is online for more then 60 days,

Loading

SCOM: SQL Server MP (Community Technical Preview 1) v6.7.3.0

Another update for the SQL Community Technical Preview management packs this time we have updates for the SQL Server MPs and no changes to the dashboards. Get the MPs here.

SQL Server 2014 / 2016:

  • Disabled Memory-Optimized Data Garbage Collection Fill Factor monitor and rule by default
  • Disabled Memory-Optimized Data workflows for all SQL Server instances, except for Developer, Enterprise, and Evaluation editions
  • Fixed issue: CPU Usage monitor & rule did not work for SQL Server cluster instance
  • Fixed issue: connection to an SQL Server instance was not closing when the destination was wrong
  • Made detection condition stricter for DB User Policy event-based discovery: added management group name
  • Made detection condition stricter for Script Failed alerting rule: added management group name

SQL Server 2008 / 2012

  • Added support for databases stored on SMB Shares
  • Fixed error logging in a script for Blocking Sessions monitor
  • Removed from the installer SQL 2005 MP files as no longer supported
  • Fixed issue: CPU Usage monitor & rule did not work for SQL Server cluster instance
  • Fixed issue: connection to an SQL Server instance was not closing when the destination was wrong
  • Fixed Non-Readable Replica detection (Always On)
  • Made detection condition stricter for DB User Policy event-based discovery: added management group name
  • Made detection condition stricter for Script Failed alerting rule: added management group name

Loading

SCOM: Updated Windows Server Operating System MP v6.0.7316.0

A new version of the Windows server OS MP was released version 6.0.7316.0 can be downloaded from here.

I would advise lab testing is possible due to the previous version of this MP mysteriously being removed from the catalog without any explanation.

The documentation only lists an updated to the “Troubleshooting and Known Issues” section. A comprehensive list is available in the MP guide.

Loading

SCOM: Management Pack for Microsoft Azure (Technical Preview) v1.3.22.0

An update for the Azure MP technical preview has been releasd and is available here

New in this version

  • Fixed issue: due to deadlock of Storage Account Capacity Probe threads, Storage Account Size Performance Collection rule did not work, and the corresponding performance counters were not collected
  • Fixed issue: service type page did not display all instances in the authoring wizard when there were more than 1000 instances
  • Fixed issue: storage account state view did not display non-classic storage accounts
  • Fixed performance stability issue observed while monitoring large subscriptions (1000+ objects): all MP components (objects monitoring, objects discovery and counters collection) did not work.
  • Added support for China subscriptions; for details, see Azure in China and Azure for the US Government section
  • Fixed issue with “Add subscription” wizard pertaining to China subscriptions; added a corresponding guidance regarding the required user activity for China subscriptions monitoring, see the corresponding Note
  • Added monitoring of Azure Application Insights alerts for web tests; for more details, see Application Insights Configuration section
  • “Known Issues” section of the guide is updated
  • Updated information about Run As Profiles configuration: Run As Profile Proxy is to be configured manually; see Security Configuration section for details

Loading

SCOM: Update from NiCE Oracle MP 4.00

Over at NiCE they’ve released an update for their Oracle MP, version 4.00 has the below improvements and you can get more information here. Including how to join their webinar on September 7th, 4pm UTC+1.

New with this Release
The following changes have been implemented for this release:

  • Improved Oracle Real Application (RAC) Monitoring
  • Oracle Service Monitoring
  • Over 50 new monitors and 50 new performance counters
  • Ease of use: Easy adding new instance to Monitoring
  • Collection scheduler: Performance and usability improvements
  • Improved alert description texts
  • Customizability: New metric filter
  • Performance counter naming improvements
  • Updated display names for MP objects
  • Size monitoring of listener and Oracle alert logs
  • Diagnostic task improvements

Loading

SCOM: Version 2.0 of Tim Culhams SCOM healh check script

Tim Culham has been promising version 2 of his health check script for a while now and let me tell you it was worth the wait, it offers a great overview of the health of a SCOM management group on a single page, get it here.

Great stuff Tim.

Features:

  • A Data Volume graph where you can instantly see the amount of Alerts, Events, Performance Data and State Changes over the last 7 days
  • The Health State of your SCOM Agents
  • A Graph of your Alert Statistics – how many Open or Closed Alerts
  • Your Management Server Health, Versions, Server Uptime & the number of Workflows they are running. Now updated to include Gateways! Also CPU, Disk and Memory Graphs for each!
  • Any Open Warning or Critical Alerts for your Gateways and Management Servers.
  • The Top 5 Alerts by Repeat Count (use this to identify recurring problems)
  • The Top 5 Events by Computer (see which computers are the noisiest)
  • Your Operational Database & Data Warehouse Servers…how much space they are using, free space, file sizes and locations.
  • Your Operational Database and Data Warehouse Backups. Make sure they are running.
  • Are the Databases being groomed? You’ll be able to tell instantly!
  • Find out what is using all of the space in your Operational Database & Data Warehouse Databases.
  • The Reporting Server and Web Console Server URL’s and if they are OK.
  • The Status of your Scheduled Reports
  • If there are any Overrides in the ‘Default Management Pack’
  • What Discoveries ran in the last 24 Hours and what Properties were changed?
  • Identify agents that are lower than the highest version installed. Use this to see which agents should be upgraded to the most current version
  • Identify Agents that are not Remoteable.
  • Is Agent Proxying Enabled?
  • What Objects are in Maintenance?
  • And it’s available in 2 different colors!

Loading

SCOM: Updated SQL Server Management Packs v6.7.2.0

After many iterations of community previews there is now a non-preview release of the SQL management packs they can be downloaded from the below locations:

Due to the many issues with some of the recent versions of the SQL management packs I would strongly advise extensive testing before deployment to production systems.

SQL Server 2016 v6.7.2.0 – here
SQL Server 2014 v6.7.2.0- here
SQL Server 2005 / 2008 / 2012 v6.7.2.0- here
SQL Server 2016 Analysis Services v6.7.2.0- here
SQL Server Dashboards v6.6.7.6 – here
SQL Server 2016 Replication v6.7.2.0- here
SQL Server 2014 Replication 6.6.4.0 – here
SQL Server 2012 Replication v 6.7.2.0 – here
SQL Server 2008 Replication v6.7.2.0 – here
SQL Server 2016 Reporting Services (Native Mode) v 6.7.2.0- here

Changes and Fixes

SQL Server Replication

  • Decreased database timeout value for some workflows to match new connection logic
  • Updated the visualization library

SQL Dashboards

  • Changed some stored procedures to improve Dashboards performance

SQL Server 2005 / 2008 / 2012 / 2014

  • Added rules for alerting when an Availability Replica changed its role and/or a Database Replica changed its role
  • Created a group for WOW64 SQL Server instances and disabled launching of some workflows for these instances
  • Added MP version line into MP’s events generated by the scripts
  • Fixed the display strings and Knowledge Base articles
  • Fixed issue: some scripts were not returning data when one of the few installed instances was stopped
  • Fixed issue: SPN configuration monitor used stale data
  • Fixed: mirroring monitoring scripts were failing when the instance was stopped

SQL Server 2016

  • Changed EventID for MP events generated by the scripts (became 4202 for the Always On scripts and 4211 for the others)
  • Disabled Memory-Optimized Data workflows for SQL Server 2016 Express
  • Added new performance rules for Always On Log Apply Pending/Ready Queue counters
  • Added rules for alerting when an Availability Replica changed its role and/or a Database Replica changed its role
  • Added MP version line into MP events generated by the scripts
  • Fixed the display strings and Knowledge Base articles
  • Fixed issue: some scripts was not returning data when one of the few installed instances was stopped
  • Fixed issue: SPN configuration monitor used stale data
  • Run As profiles are now presented in GPMP library and ready to become generic profiles for all SQL Server MPs starting with 2016
  • Fixed issue: mirroring monitoring scripts were failing when the instance was stopped

SQL Server Analysis Services and Reporting Services (Native Mode) 

  • Updated the visualization library
  • Run As profiles are now presented in GPMP library and ready to become generic profiles for all SQL Server MPs starting with 2016

Loading

SCOM: Updated Exchange 2013 MP Documentation v15.0.666.20

The Exchange Server 2013 management pack  documentation has been updated and is available for download here.

New in this version

Updated supported configuration to include Exchange Server 2016.  References to Microsoft Exchange Server 2013 functionality in this guide apply equally to Microsoft Exchange Server 2016.

Note:  The management pack will not group or monitor servers running Exchange Server 2016 separate from Exchange Server 2013 in console UI elements, or reporting.

Loading

SCOM: Understanding Optimized Collection

This posting is a follow on in my SCOM basics series.

Lets start with what is Optimized Collection?

Optimization for a collection rule only collects a value if it differs from the previous sample by a specified tolerance. This is used to reduce network traffic and the amount of data stored in the Operations Manager database.

1

How does this affect me?

When viewing performance data you need to bear in mind that if the collection rule has optimization enabled then you may see gaps in your graphs if the value has not changed significantly for some time. The below image is an example of how this might look:

2

Note: Optimization should be used for performance counters that are expected to only change gradually. For counters that are expected to vary significantly from one value to the next, optimized collection should be disabled.

Loading