Additional support is now available for SCOM 2016 for SQL 2012 SP3. this will more easily facilitate the in-place upgrade path from SCOM 2012 as previously you would need your environment to be using a SQL version supported by both SCOM versions (SQL 2014 SP2)
Kevin Holman has a nice article hi-lighting the different supported versions you can find it here
A new version of the Windows Server MP has been released version 10.0.8.0 can be found here
There are quite a few changes so as usual test in your labs where possible before deploying to live environments.
New in this version
Added two new object types (Windows Server 2016 Computer (Nano) and Windows Server 2016 Operation System (Nano)) and a new group type (Windows Server 2016 Computer Group (Nano)). This improvement will help users to differentiate the groups and object types and manage them more accurately.
Added a new monitor: Windows Server 2016 Storport Miniport Driver Timed Out Monitor; the monitor alerts when the Storport miniport driver times out a request.
Fixed bug with duplicating Nano Server Cluster Disk and Nano Server Cluster Shared Volumes health discoveries upon MP upgrade. See Troubleshooting and Known Issues section for details.
Fixed bug with Windows Server 2016 Operating System BPA Monitor: it did not work.
Fixed bug with incorrect discovery of Windows Server Operating System on Windows Server 2016 agentless cluster computers occurring upon management pack upgrade. See Troubleshooting and Known Issues section for details.
Fixed bug: Free Space monitors did not work on Nano Server.
Changed the logic of setting the override threshold values for Free Space (MB and %) monitors: a user can set the threshold values for Error state even within Warning state default thresholds. At that, the Error state will supersede the Warning state according to the set values.
Fixed localization issue with root report folder in the Report Library.
Fixed bug: Windows Server 2016 Computer discovery was causing repeated log events (EventID: 10000) due to improper discovery of non-2016 Windows Server computers.
Fixed bug: [Nano Server] Cluster Seed Name discovery was causing repeated log events (EventID: 10000) due to improper discovery of non-Nano objects.
Due to incompatibility issues in monitoring logic, several Cluster Shared Volumes MP bugs remained in version 10.0.3.0. These are now fixed in the current version (see the complete list of bugs below). To provide compatibility with the previous MP versions, all monitoring logic (structure of classes’ discovery) was reverted to the one present in version 10.0.1.0.
Fixed bug: disk free space monitoring issue on Quorum disks in failover clusters; the monitor was displayed as healthy, but actually it did not work and no performance data was collected.
Fixed bug: logical disk discovery did not discover logical disk on non-clustered server with Failover Cluster Feature enabled.
Fixed bug: Cluster Shared Volumes were being discovered twice – as a Cluster Shared Volume and as a logical disk; now they are discovered as Cluster Shared Volumes only.
Fixed bug (partially): mount points were being discovered twice for cluster disks mounted to a folder – as a cluster disk and as a logical disk. See Troubleshooting and Known Issues section for details.
Fixed bug: Cluster Shared Volume objects were being discovered incorrectly when they had more than one partition (applied to discovery and monitoring): only one partition was discovered, while the monitoring data was discovered for all partitions available. The key field is changed, and now partitions are discovered correctly; see Troubleshooting and Known Issues section for details.
Fixed bug: Windows Server 2008 Max Concurrent API Monitor did not work on Windows Server 2008 platform. Now, it is supported on Windows Server platforms starting from Windows Server 2008 R2.
Fixed bug: when network resource name was changed in Failover Cluster Management, the previously discovered virtual computer and its objects were displayed for a short time, while new virtual computer and its objects were already discovered.
Fixed bug: performance counters for physical CPU (sockets) were collected incorrectly (for separate cores, but not for the physical CPU as a whole).
Fixed bug: Windows Server 2016 Operating System BPA monitor was failing with “Command Not Found” exception. Also, see Troubleshooting and Known Issues section for details on the corresponding task.
Fixed bug: View Best Practices Analyzer compliance task was failing with exception: “There has been a Best Practice Analyzer error for Model Id”.
Fixed bug: in the Operations Console, “Volume Name” fields for logical disks, mount points, or Cluster Shared Volumes were empty in “Detail View”, while the corresponding data was entered correctly.
Fixed bug: Logical Disk Fragmentation Level monitor was not working; it never changed its state from “Healthy”.
Fixed bug: Logical Disk Defragmentation task was not working on Nano Server.
Fixed bug: If network resource name contained more than 15 symbols, the last symbols of the name was cut off, which was resulting in cluster disks and Cluster Shared Volume discovery issues.
Fixed bug: Logical Disk Free Space monitor did not change its state. Now it is fixed and considered as deprecated.
The Management Pack was checked for compatibility with the latest versions of Windows Server 2016 and updated to support the latest version of Nano Server.
Added new design for CPU monitoring: physical and logical CPUs are now monitored in different way.
Updated Knowledge Base articles and display strings.
Improved discovery of multiple (10+) physical disks.
A new version of the O365 MP is available get it here
New in version 7.1.5134.0
Upgraded subscriptions authorization method: the monitoring is carried out by an Azure application, not a specific user. Introduced two options to create an application, essential for the monitoring: manual and automatic: Microsoft Office 365 Global Administrator credentials are required for the automatic option of Azure application creation, while Azure subscription can be used for the second (manual) option. See Managing Office 365 Subscriptions section for more details.
Added a new Message Center messages type: Planned Maintenance.
The Management Pack now inquires Office 365 Service Communications API V2; added a possibility to customize the endpoints and resource URIs in advanced subscription settings of the Office 365 wizard while calling the API. The above changes are provided for further support of Chinese subscriptions.
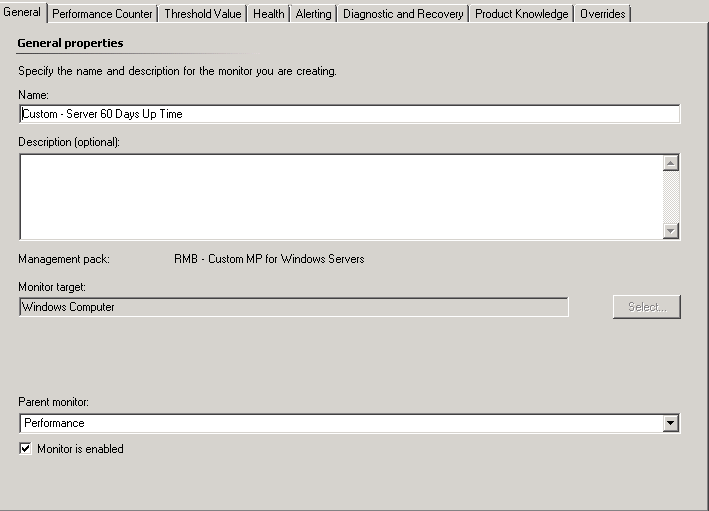
If you ever need to alert if a server has been online for more then a specific time period, you can achieve this with the following method. In this example we will be alerting if the server is up for more than 60 days.
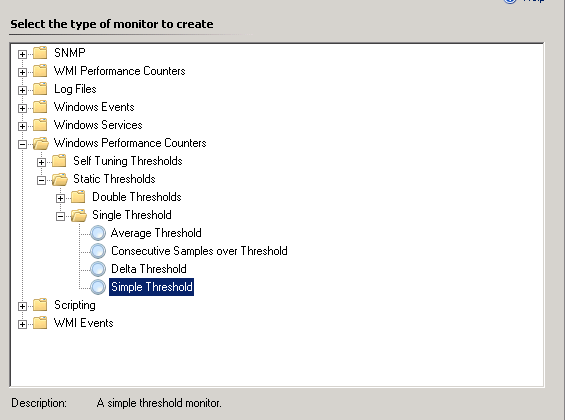
Firstly create a unit monitor > Windows Performance Counter < Single Threshold > Simple Threshold, targeting a relevant target, in this case we used Windows Computer.
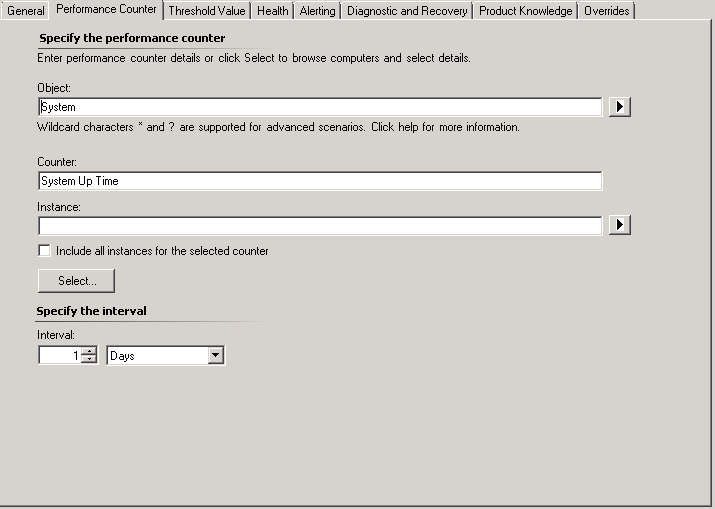
Then specify the performance counter to target the System Up Time Counter which is part of the System Object,
The threshold value is in seconds and needs to be set according to your requirement, in our case 60 days is 5184000 seconds.
You can then leave the alert details as is or specify a custom message. You will now get an alert for any server that is online for more then 60 days,
Tim Culham has been promising version 2 of his health check script for a while now and let me tell you it was worth the wait, it offers a great overview of the health of a SCOM management group on a single page, get it here.
Great stuff Tim.
Features:
A Data Volume graph where you can instantly see the amount of Alerts, Events, Performance Data and State Changes over the last 7 days
The Health State of your SCOM Agents
A Graph of your Alert Statistics – how many Open or Closed Alerts
Your Management Server Health, Versions, Server Uptime & the number of Workflows they are running. Now updated to include Gateways! Also CPU, Disk and Memory Graphs for each!
Any Open Warning or Critical Alerts for your Gateways and Management Servers.
The Top 5 Alerts by Repeat Count (use this to identify recurring problems)
The Top 5 Events by Computer (see which computers are the noisiest)
Your Operational Database & Data Warehouse Servers…how much space they are using, free space, file sizes and locations.
Your Operational Database and Data Warehouse Backups. Make sure they are running.
Are the Databases being groomed? You’ll be able to tell instantly!
Find out what is using all of the space in your Operational Database & Data Warehouse Databases.
The Reporting Server and Web Console Server URL’s and if they are OK.
The Status of your Scheduled Reports
If there are any Overrides in the ‘Default Management Pack’
What Discoveries ran in the last 24 Hours and what Properties were changed?
Identify agents that are lower than the highest version installed. Use this to see which agents should be upgraded to the most current version
This posting is a follow on in my SCOM basics series.
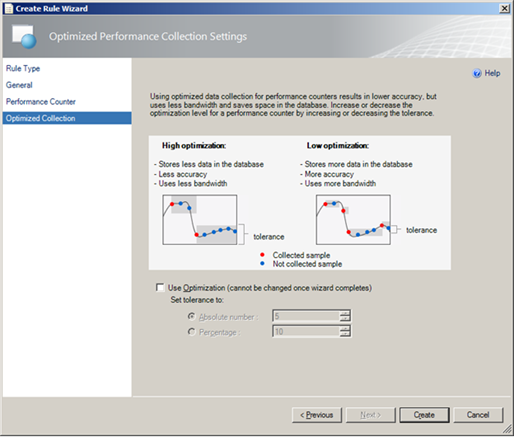
Lets start with what is Optimized Collection?
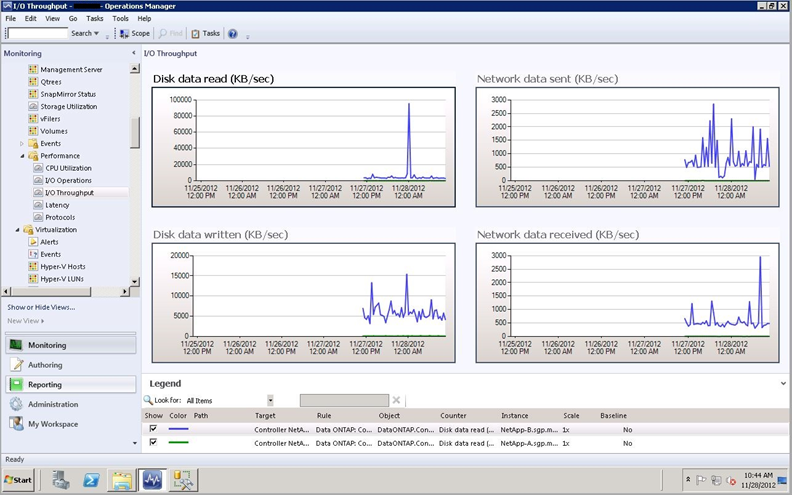
Optimization for a collection rule only collects a value if it differs from the previous sample by a specified tolerance. This is used to reduce network traffic and the amount of data stored in the Operations Manager database.
How does this affect me?
When viewing performance data you need to bear in mind that if the collection rule has optimization enabled then you may see gaps in your graphs if the value has not changed significantly for some time. The below image is an example of how this might look:
Note: Optimization should be used for performance counters that are expected to only change gradually. For counters that are expected to vary significantly from one value to the next, optimized collection should be disabled.
An update to the SQL management packs Community Technical Preview is now available here.
There have been additions for SQL Server 2016 SSRS and SSAS and minor improvements to the other existing management packs. Hopefully when this reaches public release it will avoid the issues of previous SQL mp versions.
Note: it looks like 6.0.7310.0 has been pulled and replaced with 6.0.7297.0 no reason has been given at this time.
The windows Server MP has been updated to v 6.0.7310.0 it is available for download here.
Changes in this version
Several bugs located in Clustered Shared Volumes MP were fixed (see below); error handling migrated to common recommended scenario. Enabled quorum monitoring via changing the monitoring logic. The monitoring logic is splitting for Nano Server (with usage of PowerShell) and all other operation systems.
o Fixed bug: disk free space monitoring does not work on Quorum disks in failover clusters.
o Fixed bug: logical disk discovery did not discover logical disk on non-clustered server with Failover Cluster Feature enabled.
o Fixed bug: clustered shared volumes were being discovered twice – as a clustered shared volume and as a logical disk.
o Fixed bug: mount points were being discovered twice for clustered disks mounted to a folder – as a clustered Disk and as a logical disk.
o Fixed bug: Clustered Shared Volume was being discovered incorrectly when it had more than one partition (applied to discovery and monitoring).
Added support for Nano Server Failover cluster disk monitoring: the monitoring logic was fixed based on improved cluster discovery with registry and WMI. Error handling was also corrected. Logical disk correct discoveries on non-cluster server with Failover Clustered Server Feature is installed.
Created new overrides for Clustered Shared Volume MP, as long as the old ones did not work.
Some cosmetic changes were introduced for cluster disk monitors alert messages.
A post I came across from Ian Blyth with a short powershell script to show which Resource Pools your management servers are part of. It’s quite useful to see all of the resource pool members in one place without having to open each one in the console, particularly in larger environments.