I encountered a minor issue today which luckily proved simple to solve. Hopefully this proves useful to others.
The Issue:
In a brand new SCOM 2019 deployment the scheduled reports weren’t sending. After investigation I found the below error in the Application log on the SSRS server:
SQL Server Scheduled Job ’62A9826E-082B-4ACD-9270-6BC13FC260BE’ (0x832F33183531EF4483665BBBFCCEBD9A) – Status: Failed – Invoked on: 2020-08-05 11:00:00 – Message: The job failed. Unable to determine if the owner (DOMAIN\USER) of job 62A9826E-082B-4ACD-9270-6BC13FC260BE has server access (reason: Could not obtain information about Windows NT group/user ‘DOMAIN\USER’, error code 0x5. [SQLSTATE 42000] (Error 15404)).
The Solution
The SSRS Instance, in this case SQL 2016 SP2, was deployed using system accounts for the SQL Server and SQL agent services. Simply changing these to use a domain account with access to the SQL instance resolved the issue and reports started sending shortly after.
It’s quite a common ask, as to how to take the data in an Azure Monitor Logs workspace and create a report that can then be scheduled. Lets take a look at how we can achieve that.
Immediately we are talking about automation when we use the word schedule and Azure has several tools which we can use. The best fit in this case is Logic Apps.
In this example we will create a report showing if any agents haven’t had a successful heartbeat in the past 24 hours.
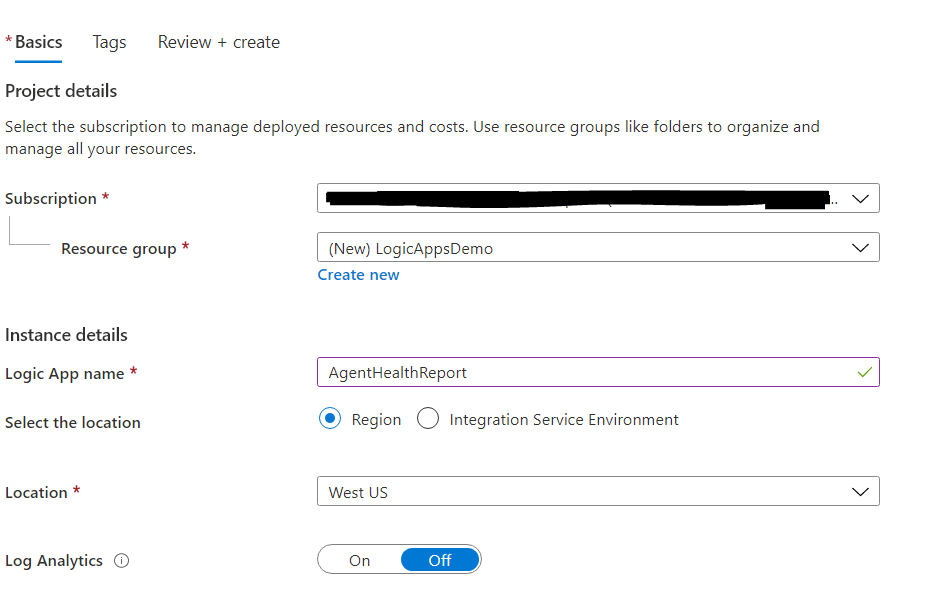
Navigate to the Logic Apps blade in your Azure Portal and click +Add
Populate the fields selecting my subscription and resource group, creating a new RG if necessary. Then I’ll give my logic app a name and choose my Azure region and click Review + Create and then Create
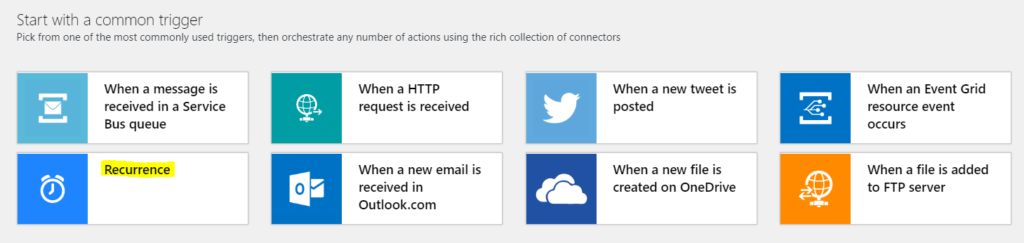
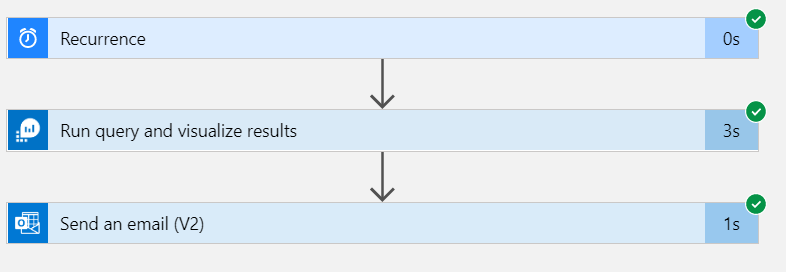
Once the deployment is complete I can navigate to the resource and it automatically opens the Logic Apps Designer. Now every Logic App needs to start with a trigger and because I want to run a schedule I am going to use Recurrence
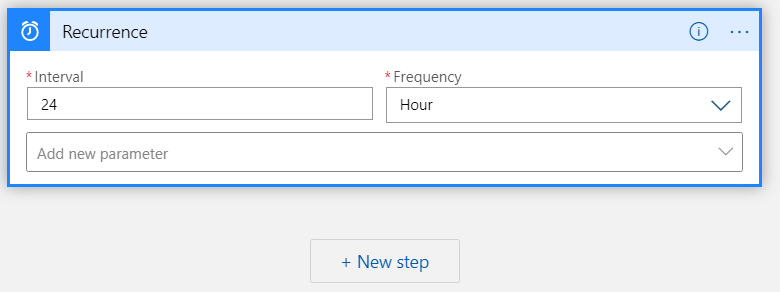
I want this on a daily basis so I’m going to enter 24 Hour as my parameters and then click new step
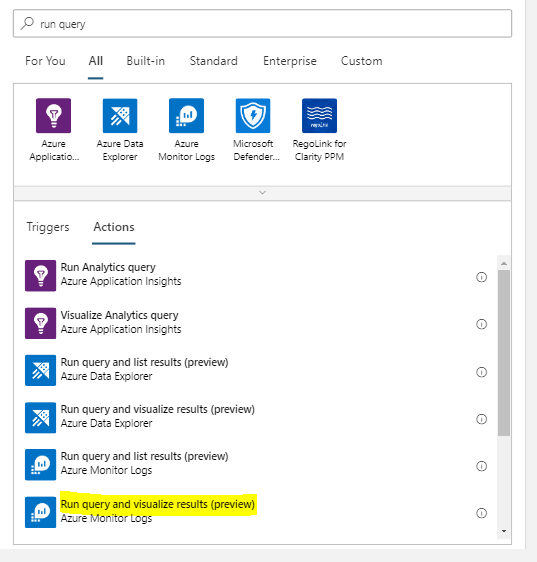
Search for Run Query and Visualize Results as this option will allow a KQL query as a parameter and the results can be manipulated in a variety of ways. Make sure to select the one for Azure Monitor Logs and not for Azure Data Explorer.
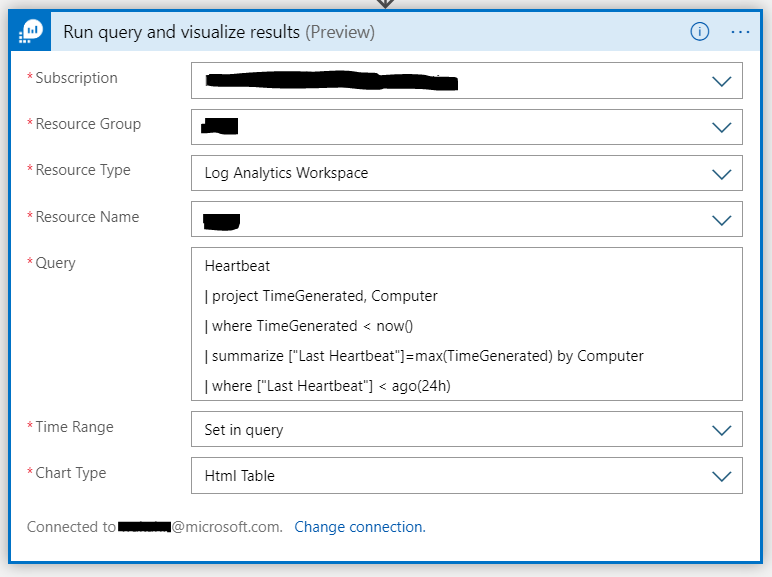
You will need to sign in to create a connection with Azure Monitor Logs. Now populate the fields choosing the subscription, resource group and workspace that contains the data you want to use in your report. Put your query in the relevant section and choose chart type HTML.
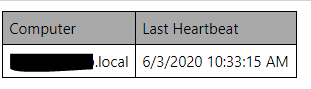
Heartbeat
| project TimeGenerated, Computer
| where TimeGenerated < now()
| summarize ["Last Heartbeat"]=max(TimeGenerated) by Computer
| where ["Last Heartbeat"] < ago(24h)
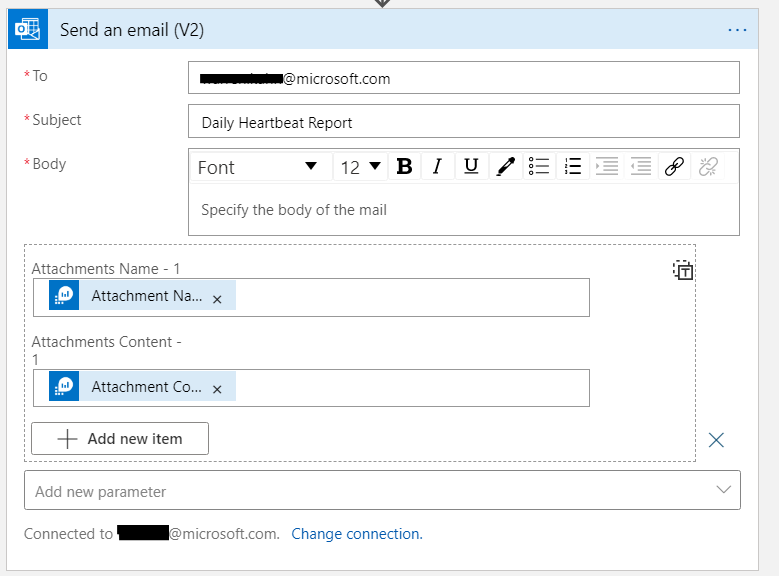
The last thing that needs to be done is connect the logic app to a step to send email, click New Step, search for send an email, I’ll be using Office365 but you can use other providers. Select Send an email v2 and sign in to create the connection.
Populate as below making sure to include the attachments
Click save and we’re all good to go. Now test by clicking Run.
You should receive an email with an attachment and voila opening it will have a nice html table with our query results.
These steps can be easily replicated and amended to be used for any number of handy reports using your Azure Monitor Logs data.
Just the thing you want to see on a Monday morning, clicking on the Reports node and seeing the following error:
Message: Report subscription list could not be loaded.
System.InvalidOperationException: Client found response content type of ”, but expected ‘text/xml’.
The request failed with an empty response.
at System.Web.Services.Protocols.SoapHttpClientProtocol.ReadResponse(SoapClientMessage message, WebResponse response, Stream responseStream, Boolean asyncCall)
at System.Web.Services.Protocols.SoapHttpClientProtocol.Invoke(String methodName, Object[] parameters)
at Microsoft.EnterpriseManagement.Mom.Internal.UI.Reporting.ReportingService.ReportingService2005.ListSubscriptions(String Report, String Owner)
at Microsoft.EnterpriseManagement.Mom.Internal.UI.Reporting.ManagementGroupReporting.GetSubscriptions(String owner)
at Microsoft.EnterpriseManagement.Mom.Internal.UI.Reporting.Views.ReportSubscriptionsView.ReportSubscriptionsView.LoadSubscriptionsJob(Object sender, ConsoleJobEventArgs args)
An investigation determined that the reporting services action account needed to be re-registered to the ASP.NET IIS framework using the following command.
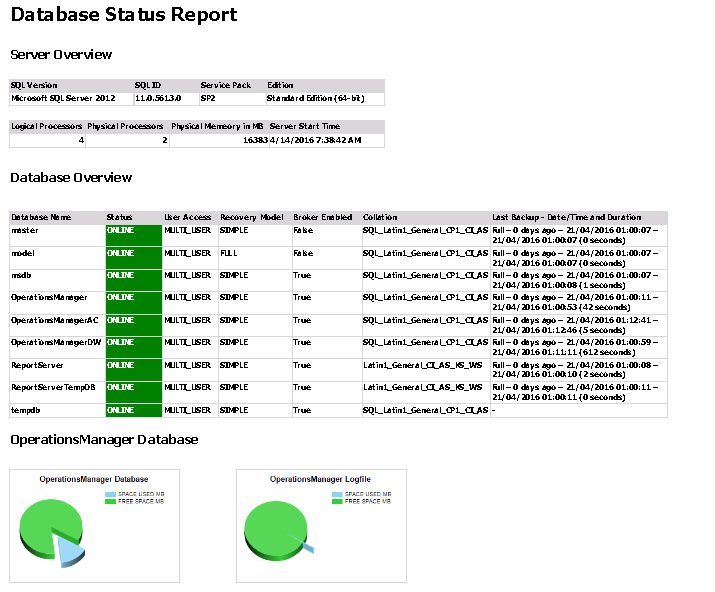
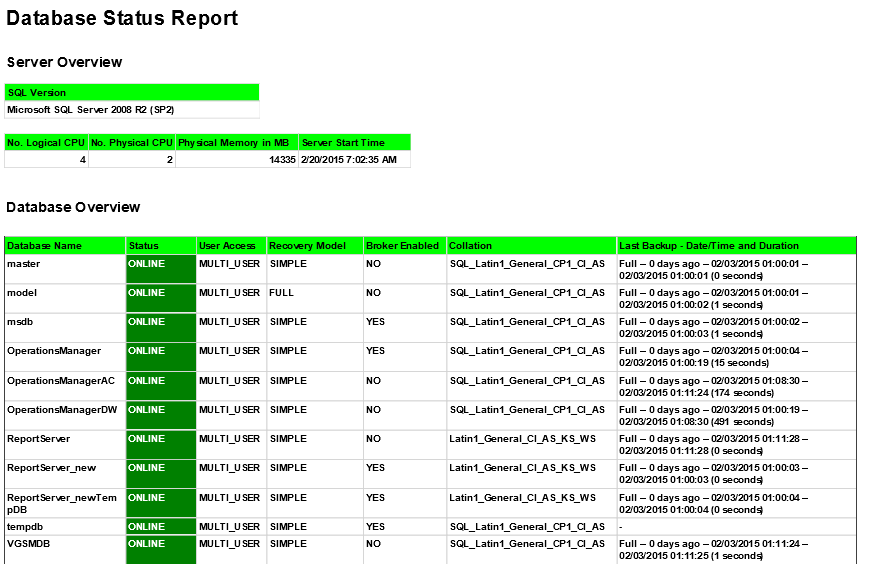
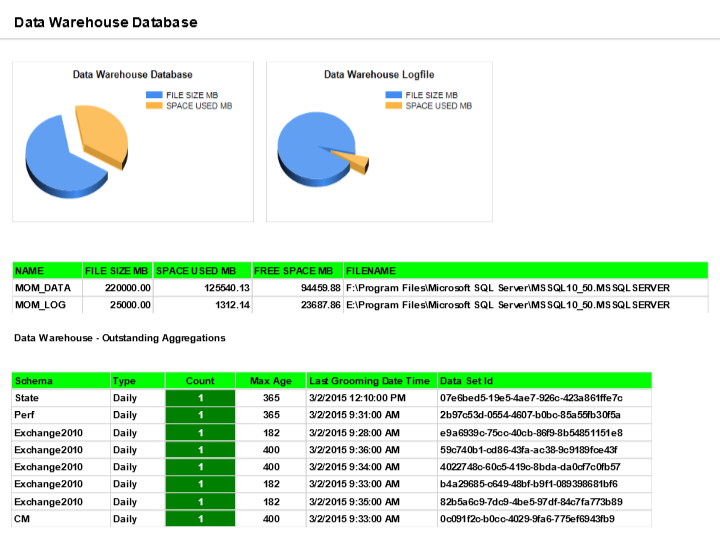
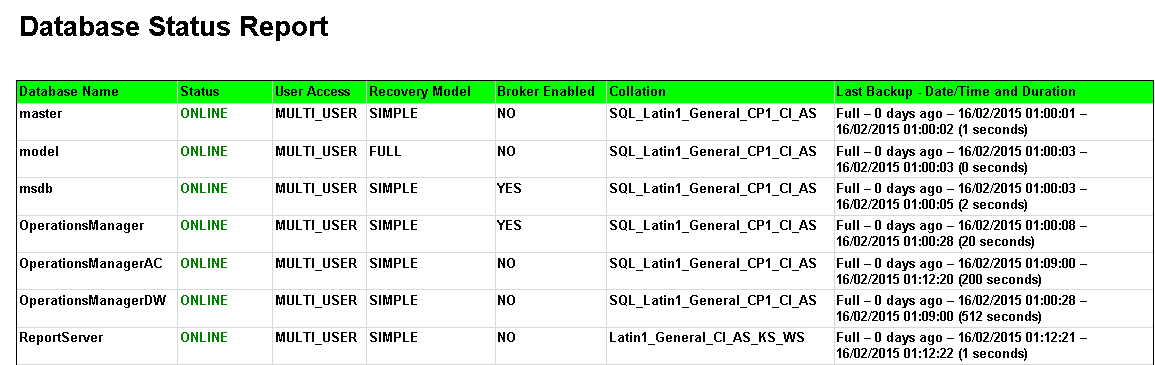
Last month I blogged about a SCOM Database Status Report that I was working on in order to get a single page overview of the SQL environment for a SCOM implementation, as a starting point to a complete SCOM heath report.
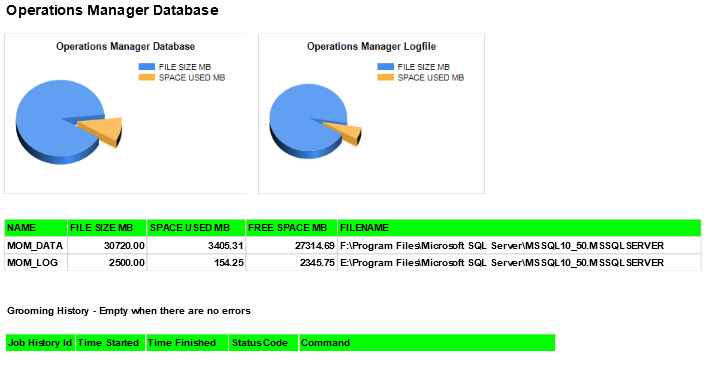
Below are samples of version 3 of the report which now includes additional sections for the OperationsManager database as well as the Data Warehouse. I have also amended some of the colouring to make important aspects easier to identify.
I would be interested to hear from anyone who has any comments or suggestions on this report or ideas for future ones.
Veeam recently released the v7 R2 version of their System Center Management Pack.
Go here for more information, a free trial and pricing.
This update looks to be a nice step forward in terms of functionality and visibility of the virtual layer, which can be neglected when monitoring an environment.
New in this version:
NEW tools help you get results fast. An updated Resource Kit, which is part of the install, accelerates and simplifies deployment with an updated Database Sizing Calculator, scripts for deployment and configuration, and ‘mini’ MPs for customization.
NEW enhanced database efficiencies boost performance under large, enterprise loads and reduce Veeam MP’s footprint in the System Center database more than 50%.
NEW app-to-metal visibility as well as metal-to-app visibility allows you to quickly trace problems and determine business impacts for both physical and virtual resources.
NEW capabilities help you quickly identify undersized vSphere VMs so you can provide more resources where needed to power critical applications.
NEW platform support for Veeam Backup & Replication v8 and System Center 2012 R2 Update Rollups.
New in v7 R2, if you have System Center agents on any VMs, you’ll be able to drill down in two directions for both app-to-metal and metal-to-app visibility. You can quickly identify apps being monitored on a specific VM to find services and applications that will be affected by compute, storage and networking problems. And you can navigate a topology tree to locate the host for a specific VM to see if there are any problems occurring below this level―whether in that specific VM, other VMs, host hardware or elsewhere.
Veeam has released a new version of their popular Report Library for System Center, this version, 7.0 R2 follows the release of the hyper-v enabled Veeam Management Pack v7 for System Center and is available for download here.
The Veeam Report Library for System Center includes:
Veeam Alert History Report – shows information on alerts raised for infrastructure objects across a time range.
Veeam Performance Report – aggregates historical data to show performance counter values on one or more charts and tables.
Veeam Performance Details Report – aggregates historical data to show performance counter values with drill down for data.
Veeam Generic Performance Top (Bottom) N Report – aggregates historical performance data to show top or bottom N infrastructure objects, performance counters, or both, for a specific rule.
Veeam Relationship History Report – allows you to choose a specific type of relationship between infrastructure objects and track changes for this relationship over a time interval.
Veeam State Summary Report – shows the time in healthy/unhealthy state for selected infrastructure objects’ monitor across a time range.
A new free eBook has been released about Extending Operations Manager Reporting, it is available for download here.
Introduction
The System Center Operations Manager data warehouse stores many objects, making it possible to report on performance, availability, configuration, and security. You can use data collected by Operations Manager for issue tracking, awareness, planning, and forecasting, all of which are important factors for maintaining and managing your environment. But understanding what to report on and how to do so is what actually contributes to the stability of your infrastructure. If you’re not using the data you collect about your environment, you’re simply wasting space. If you use Operations Manager to monitor your environment, whether your infrastructure or a public, private, or hybrid cloud, this book is a good resource to help you understand the basics of reporting and how to build queries and stored procedures for your reports. It can also help you understand the various elements of Operations Manager management packs that are used when you create reports. This book assumes that you have a good understanding of Operations Manager and the management pack structure required to create custom reports. It also assumes that you have a good working knowledge of SQL Server and tools like Report Builder, Business Intelligence Development Suite, and SQL Server Data Tools.