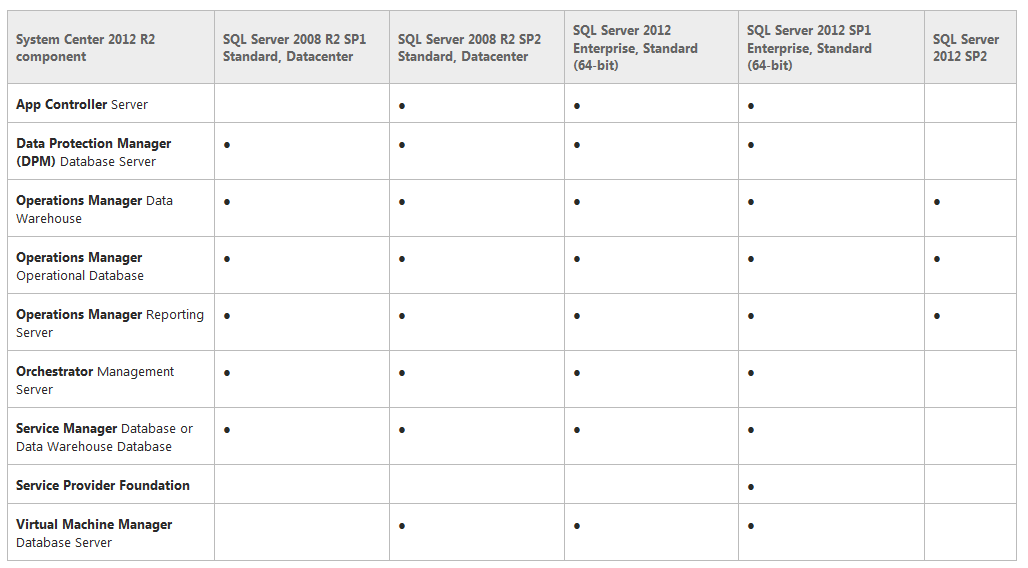
This article was posted on the Operations Manager Engineering blog this week detailing the newly included support for SCOM 2012 R2 having SQL Server 2014 Enterprise, Standard (64-bit) as its database.
They note the following issues and workarounds to be aware of:
Issue: Installation to a SQL 2014 cluster using Cluster Shared Volumes (CSV) is blocked by SCOM 2012 setup. Workaround: Deploy to a physical server and then use the documentation here to move the database to the CSV.
Issue: Upgrade of SQL SRS is blocked due to SCOM 2012 use of Custom Security Extensions. Workaround: Uninstall SCOM Reporting and run ResetSRS.exe to clear the custom security extensions. Once that is complete, upgrade SQL and install SCOM 2012 reporting again. Can find similar steps in the documentation here.
Veeam recently released the v7 R2 version of their System Center Management Pack.
Go here for more information, a free trial and pricing.
This update looks to be a nice step forward in terms of functionality and visibility of the virtual layer, which can be neglected when monitoring an environment.
New in this version:
NEW tools help you get results fast. An updated Resource Kit, which is part of the install, accelerates and simplifies deployment with an updated Database Sizing Calculator, scripts for deployment and configuration, and ‘mini’ MPs for customization.
NEW enhanced database efficiencies boost performance under large, enterprise loads and reduce Veeam MP’s footprint in the System Center database more than 50%.
NEW app-to-metal visibility as well as metal-to-app visibility allows you to quickly trace problems and determine business impacts for both physical and virtual resources.
NEW capabilities help you quickly identify undersized vSphere VMs so you can provide more resources where needed to power critical applications.
NEW platform support for Veeam Backup & Replication v8 and System Center 2012 R2 Update Rollups.
New in v7 R2, if you have System Center agents on any VMs, you’ll be able to drill down in two directions for both app-to-metal and metal-to-app visibility. You can quickly identify apps being monitored on a specific VM to find services and applications that will be affected by compute, storage and networking problems. And you can navigate a topology tree to locate the host for a specific VM to see if there are any problems occurring below this level―whether in that specific VM, other VMs, host hardware or elsewhere.
Update Rollup 5 for System Center 2012 R2 has just been released, this KB article contains full information around the included fixes. The article also contains the installation instructions and download link.
A fix I am glad to see in here is the one around Specified cast is not valid when opening run as account properties which is an issue I blogged about 2 years ago.
All in all this seems like a good update, as always test before going live.
Kevin Holman has written an excellent article on the murkey subject of SNMP Trap monitoring with SCOM 2012 R2. This is definitly worth a read if you’ve ever been unclear on how this works.
It’s also nice to know once and for all “First clarification (and update to this blog post) – There is NO NEED to install or configure the SNMP service on the management server. We don’t use the SNMP stack. In fact – if the SNMP TRAP service is running (it does not by default) then only thing I need to do is make sure it is disabled! “
He has also kindly included MP authoring examples which you can use to get this running for your own scenarios.
Microsoft has released Update Rollup 4 for System Center 2012 R2 Operations Manager. All in all a good update and as always test in your labs before deploying to production,
It is available for download here and contains fixes for the following issues:
Issue 1
It takes many minutes for the Microsoft.Windows.CheckNTServiceStateMonitorType function to determine that the service is down.
Issue 2
An attempt to apply sensitivity rules fails, and you receive the following error message:
The monitoring configuration contains errors and cannot be applied.
Exception: System.ApplicationException: Attribute ‘regexCompare’ is null
at Microsoft.EnterpriseManagement.Modules.Apm.LibraryConfigManager.Tools.XmlTools.GetMandatoryAttribute(String attributeName, XmlNode node)
at any attempt to apply sensitivity rules fails with the errorMicrosoft.EnterpriseManagement.Modules.Apm.LibraryConfigManager.Modules.ApmModule.Core.Actions.AgentHandlersConfig.HiddenRuleXmlDeserializer.Deserialize(XmlNode rowData)
Issue 3
GSM locations are geotagged incorrectly on Map Widget.
Issue 4
The MonitoringHost.exe process issues too many calls to System Center Failover Clustering.
Issue 5
The re-synchronization of all managed entities from Operations Manager to the Operations Manager Data Warehouse database causes duplicate entries, and an exception that resembles the following is thrown:
Data was written to the Data Warehouse staging area but processing failed on one of the subsequent operations.
Exception ‘SqlException’: Sql execution failed. Error 2627, Level 14, State 1, Procedure ManagedEntityChange, Line 367, Message: Violation of UNIQUE KEY constraint ‘UN_ManagedEntityProperty_ManagedEntityRowIdFromDAteTime’. Cannot insert duplicate key in object ‘dbo.ManagedEntityProperty’.
Issue 6 If data is truncated and is in Terminal status to a workflow, event ID 31551 is logged, and an exception that resembles the following is thrown:
Failed to store data in the Data Warehouse. The operation will be retried.
Exception ‘InvalidOperationException’: The given value of type String from the data source cannot be converted to type nvarchar of the specified target column.
One or more workflows were affected by this.
Workflow name: Microsoft.SystemCenter.DataWarehouse.CollectAlertData
Issue 7 An arithmetic overflow error occurs, and an exception that resembles the following is thrown:
Data was written to the Data Warehouse staging area but processing failed on one of the subsequent operations.
Exception ‘SqlException’: Sql execution failed. Error 8115, Level 16, State 2, Procedure RelationshipChange, Line 180, Message: Arithmetic overflow error converting expression to data type int.
Issue 8
You experience poor performance when Operations Manager searches for attributes. Additionally, when doing more than one search in a row, the cache file (momcache.mdb) keeps increasing.
Issue 9
SCX agent generates lots of warnings in the log file when a user is using Security-Enhanced Linux (SELinux).
Issue 10
By default, the Rpcimap monitor for Red Hat Enterprise Linux 6 is disabled.
Microsoft have just released Update Rollup 3 for SCOM 2012 R2 it is available for download here or via windows updates.
There are a few known issues with this update so be sure to read the KB article and test thoroughly before implementing.
Several issues are fixed with this update including those below:
A deadlock condition occurs when a database is connected after an outage. You may experience this issue may when one or more HealthServices services in the environment are listed as Unavailable after a database goes offline and then comes back online.
The Desktop console crashes after exception TargetInvocationException occurs when the TilesContainer is updated. You may experience this issue after you leave the console open on a Dashboard view for a long time.
The Password expiration monitor is fixed for logged events. To make troubleshooting easier, this fix adds more detail to Event IDs 7019 and 7020 when they occur.
The Health service bounces because of high memory usage in the instance MonitoringHost: leak MOMModules!CMOMClusterResource::InitializeInstance. This issue may be seen as high memory usage if you examine monitoringhost.exe in Performance Monitor. Or, the Health service may restart every couple of days , depending on the load on the server.
The Health service crashes in Windows HTTP Services (WinHTTP) if the RunAs account is not read correctly.
Windows PowerShell stops working with System.Management.Automation.PSSnapInReader.ReadEnginePSSnapIns. You may see this issue as Event ID 22400 together with a description of “Failed to run the Powershell script.”
The PropertyValue column in the contextual details widget is unreadable in smaller widget sizes because the PropertyName column uses too much space.
The update threshold for monitor “Health Service Handle Count Threshold” is reset to 30,000. You can see this issue in the environment, and the Health Service Handle Count Threshold monitor is listed in the critical state.
An acknowledgement (ACK) is delayed by write collisions in MS queue when lots of data is sent from 1,000 agents.
The execution of the Export-SCOMEffectiveMonitoringConfiguration cmdlet fails with the error “Subquery returned more than 1 value.”
The MOMScriptAPI.ReturnItems method can be slow because a process race condition may occur when many items are returned, and the method may take two seconds between items. Scripts may run slowly in the System Center Operations Manager environment.
When you are in the console and click Authoring, click Management Pack, click Objects, and then click Attributes to perform a Find operation, the Find operations seems unexpectedly slow. Additionally, the Momcache.mdb file grows very large.
A delta synchronization times out on SQL operations with Event ID 29181.
Operations Manager grooms out the alert history before an alert is closed.
The time-zone settings are not added to a subscription when non-English display languages are set. Additionally, time stamps on alert notifications are inaccurate for the time zone.
Web Browser widget requires the protocol (http or https) to be included in the URL.
You cannot access MonitoringHost’s TemporaryStoragePath within the PowerShell Module.
The TopNEntitiesByPerfGet stored procedure may cause an Operations Manager dashboard performance issue. This issue may occur when a dashboard is run together with multiple widgets. Additionally, you may receive the following error message after a time-out occurs:
Update Rollup 7 for System Center 2012 Operations Manager Service Pack 1 has also been released and is quite a minor update in comparison to the fixes for R2.
Below are the fixes for that update:
The Reset the baseline, Pause the baseline, and Resume the baseline actions fail when you run them against an optimized performance collection rule.
The DeltaSynchronizationengine work item times out on SQL operations, and Event ID 29181 is generated.
Execution of the Export-SCOMEffectiveMonitoringConfiguration cmdlet fails, and you receive the following error message:
Subquery returned more than 1 value.
Time-zone settings are not added to subscriptions when non-English display languages are set.
The Operations Manager dashboard experiences a performance issue that is caused by the TopNEntitiesByPerfGet stored procedure.
It is always great when the capabilities of Operation Manager are extended to monitor new areas that were previously outside of the general WinTel scope. The latest addition from NiCE is a zLinux management pack.
The NiCE zLinux MP is the first product of its class that provides monitoring of Linux server distributions on the IBM system z platform using Microsoft System Center. IBM System z is a universal name used by IBM for all its mainframe computers. These mainframe computers have gone through a number of name changes and are also known as System/390 or zSeries.
This management pack allows for inclusion of your zLinux components into your SCOM system which enables you to get a complete picture of the systems that are dependent on zLinux in a single end-to-end view.
Features • Perform ‘Logical Disk Health checks’i.e. easily ascertain the availabilityand performance of your LogicalDisk (File System) instances • Carry out ‘Network AdapterHealth checks’ i.e. determine theavailability and performance ofyour Network Adapter instances • Execute ‘Operating System Healthassessments’ i.e. effortlesslydiscover the availability andperformance for Red Hat Enterprise Linux Server Operating Systeminstances • Determine the health of yourprocessor by effectively monitoringyour processor instances
With the release of SCOM 2012 R2 Microsoft has official amended the supported SQL collation settings. In the past you had to use SQL_Latin1_General_CP1_CI_AS, this was due to the data warehouse being installed with this setting by default regardless of the SQL server collation setting. This was a nice addition which has been due for a long time, having collation mismatches between your OpsDB and DW can cause a whole host of issues which are well documented.
Of course the new settings only apply to fresh installations, when upgrading the previous collation settings will still be used.
Click here for the complete supported configuration.