A preview has been released for the Windows Server 2016 Guarded Fabric management pack it is available for download here.
The Windows Server 2016 Guarded Fabric Management Pack enables discovery and monitoring of guarded hosts and Host Guardian Service instances in your environment with System Center Operations Manager. The alerts surfaced by this management pack will help you quickly detect and remediate service availability issues with the Host Guardian Service and Hyper-V host misconfigurations that could prevent you from succesfully starting up shielded VMs. Please note that this is a preview release of the management pack and is not suitable for production deployments.
A new MP for SharePoint Server 2016 has been released it is available for download here.
The guide does not seem to be in the catalog yet but setup seems to be the same at for the SharePoint 2013 MP.
The SharePoint management packs can be quite tricky to get working, there are some particular access requirements which aren’t completely documented.
Local admin on all SharePoint Front End and Application Servers
Local admin on all SQL machines that host SharePoint databases
Full Farm Administrator rights within SharePoint
DBO for all SharePoint databases
With the above access and correct configuration of the run as account and microsoft.sharepoint.library.mp.config all should be fine.
Note: microsoft.sharepoint.library.mp.config needs to be in the same location on all management servers in your management group. Otherwise the discovery task might not complete.
This posting will be updated as more features come to light
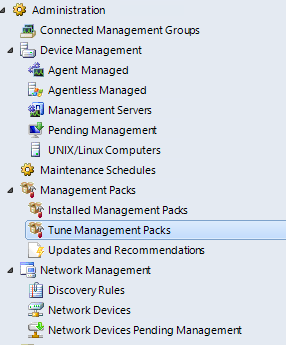
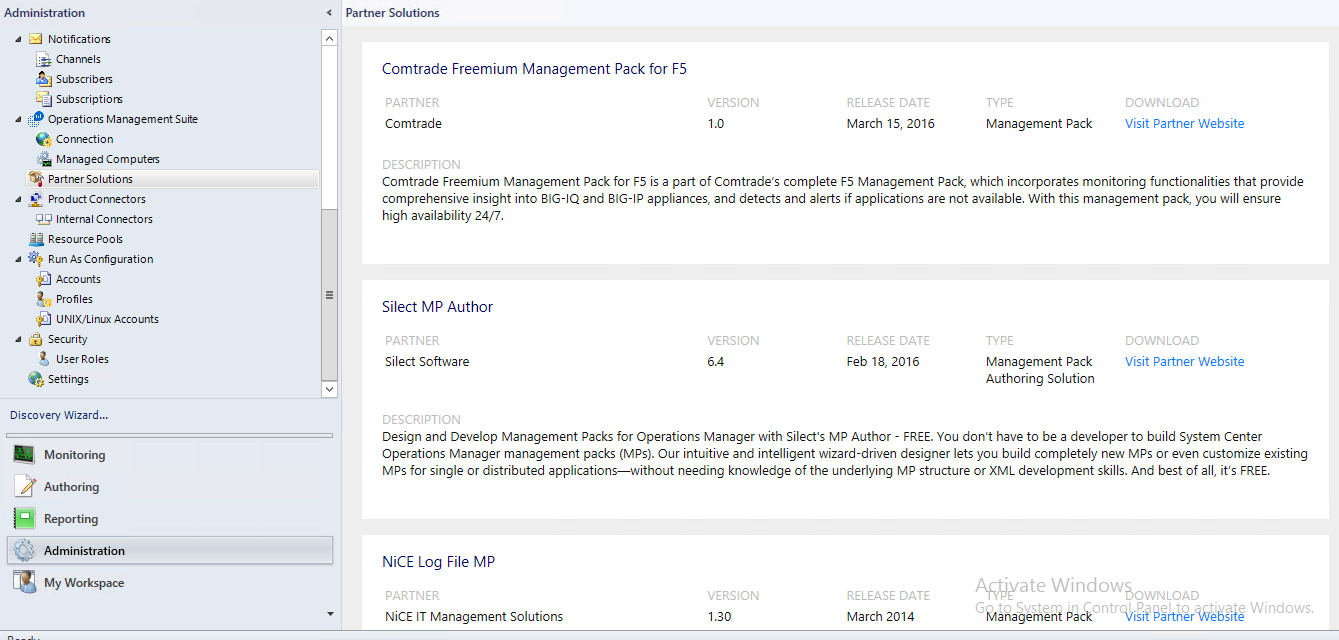
At first glace there isn’t a whole lot new floating around, the administration pane has the following, Tune Management Packs and Partner Solutions:
Tune Management Packs
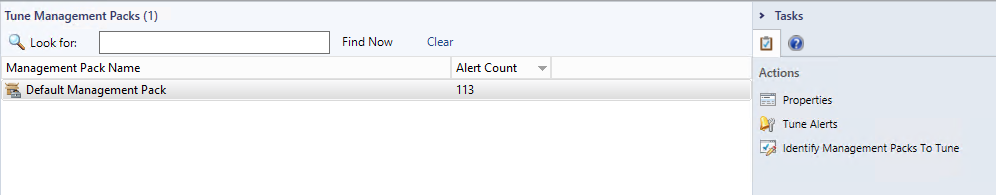
This feature will show which management packs are generating the most noise.
Once alerts are populating the Tune Management pack view will give you an overview of how many alerts are being generated by each management pack, filtered by a date range you specify. Unfortunately you cannot choose a filter such as “previous week”
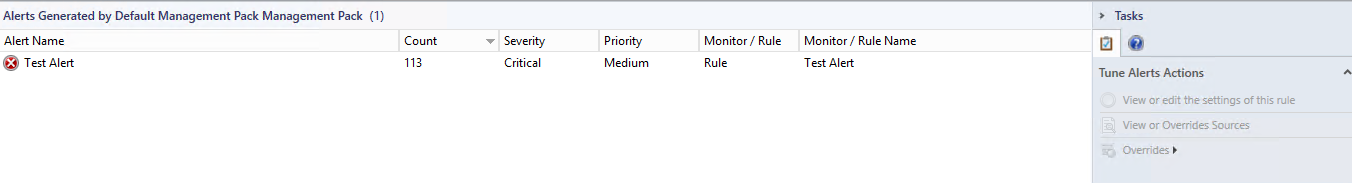
Clicking the Tune Alerts task will display a list of the alerts from that management pack with count, location, type and name. You can access the rule / monitor settings directly from this location to make it easy to reduce noise.
Partner Solutions
This feature is actually from one of the later 2012 UR’s but I’ll keep it here due to it being relatively unnoticed. Partner solutions gives a nice view into the 3rd party management packs that are available, it’s easier to than the marketplace and less hassle then trawling through search engines. I’d like to see more from this feature.
Console optimization
Some improvements have been made to the console this should be especially noticeable in environments with heavy load on the databases. Hopefully this mean less “busy” in the bottom left corner.
Alert view is optimized to load efficiently
Alert tasks and alert details in alert view is optimized to load efficiently
Context menus of an alert in alert view is optimized to load efficiently
Improved scalability for Unix/Linux Agents monitoring
A nice addition for those with large *nix environments is that the supported amount of cross platform agents per management server has been effectively doubled.
This has been achieved by using the new Async Windows Management Infrastructure (MI) APIs instead of WSMAN Sync APIs. By default, Operations Manager would use the sync APIs. To switch to the new method you need to create a new Registry key “UseMIAPI” to enable Operations Manager to use the new Async MI APIs.
To enable the new Async MI APIs – create a Registry key “UseMIAPI” under HKLM:\Software\Microsoft\Microsoft Operations Manager\3.0\Setup
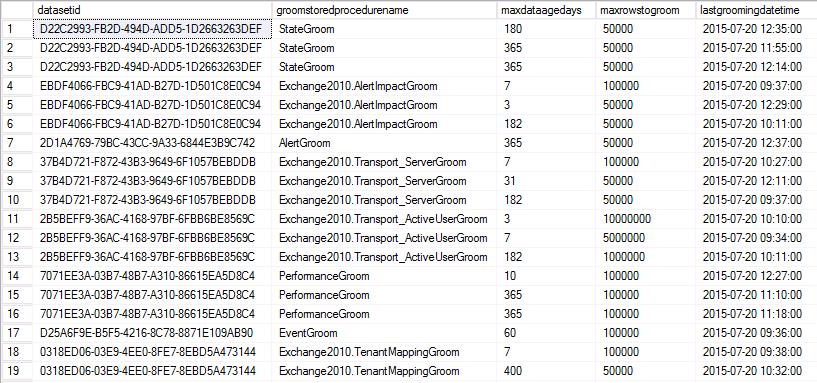
This posting is a continuation of my basics series, this one deals with Understanding Grooming and Aggregation, two very important concepts which can have great impact on your environment if they are not functioning properly.
First you need to understand the different between these two concepts, at their most basic, Grooming is the method where data older then a specific period, called the retention period, is deleted. Aggregation is the method where raw data, which is collected on short intervals i.e. 5 minutes, are averaged into hourly and daily time intervals used for reporting purposes.
The Operations Database
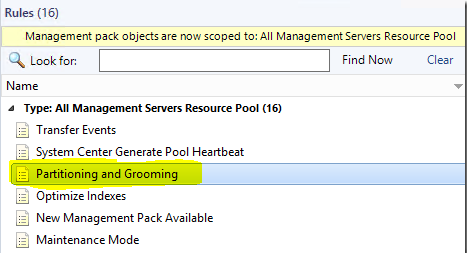
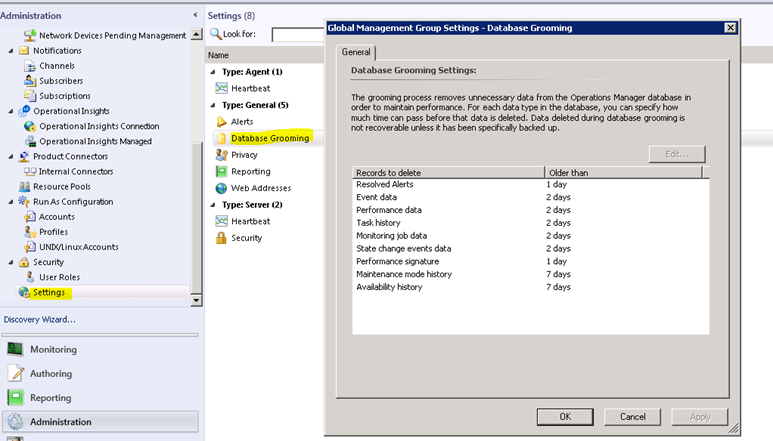
A stored procedure, called p_PartitioningandGrooming is run by a SCOM rule on a once a day schedule. The retention settings for each data type can be set in the console under Administration > Settings > Database Grooming.
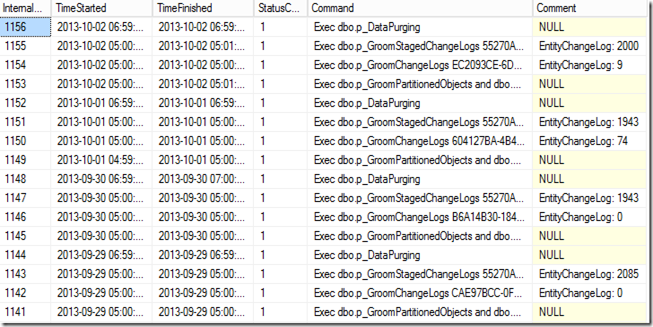
You can see the history of the OpsDB grooming jobs with the following SQL query:
select * from InternalJobHistory order by InternalJobHistoryId desc
A Status of 1 indicates a successful completion.
The Operations Data-warehouse
The Data Warehouse is more complex, you cannot change data retention settings from the console, they exist in a table called StandardDatasetAggregation, which contains the grooming and aggregation retention periods, intervals and other related data.
Data in the DW database moves through several tables as part of the aggregations process as the data is collected it is written to a Raw Data table, from there is will move to a Staging table where it will be aggregated and then moved to a relevant aggregated data table (Hourly / Daily) where it will be available to the reporting services.
Then once the data in these tables is older then the data retention period it will be groomed out of the database.
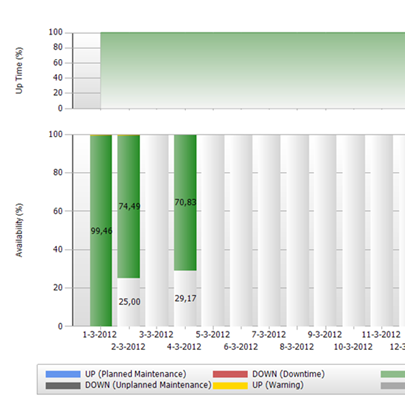
So why is it important for aggregation to work?
Reports use the hourly and daily data in order to generate, this means that if your aggregations are not working or slow there will be gaps in your reporting. Example below:
And there you have it. the basics behind aggregation and grooming, I hope this has been informative.
An updated SCCM MP has been released and is available here.
The guide refers to itself as being an RTM release and doesn’t include any change log so testing will be required. There is however an extensive appendix which includes a list of rules/monitors for every SCCM component.
A Community Technical Preview has been released for all of the SQL server versions and components they are available for download here. This MP is accompanied by a refresh of the SQL MPs released earlier this month v6.6.7.6, could this be an attempt to improve QA and testing on management pack releases, especially considering the issues with the SQL MP over the past year.
The new features and fixes introduced in CTP1 management packs are as follows:
New Analysis Services 2016 MP Features and Fixes
Updated references and removed deprecated elements to support 6.6.4.0+ visualization library
Fixed bug when SSAS Monitoring Pack could not collect OS performance counters with localized names
Updated discoveries to throw errors in case of some problems detected during the discovery
Fixed module error collection on cluster instances to reduce the noise
Changed defaults for CPU Usage monitor, added sampling to Memory Usage on the server monitor
Reduced inner complexity of modules
Fixed the discoveries; now the last items can be undiscovered
Simplified the dashboard to make it quicker and more informative
Reviewed and updated the Knowledge Bases
Added timeout support for every non-native workflow
Fixed Blocking Session Monitor – in some situations it could calculate blocking sessions incorrectly
Win10 support: fixed OS version detection issue
Fixed CPU usage alert description
“Known Issues and Troubleshooting” section of the guide is updated
New Reporting Services 2016 MP Features and Fixes
Fixed issue: Microsoft System Center Management Pack for SQL Server Reporting Services doesn’t discover SSRS instance when the instance name starts from some certain symbols (0-9, A-F)
Instance configuration monitor is introduced
Implemented a better logging system
Improved the Report Manager availability monitor: now it parses human readable message to get the real status of the Report Manager
Improved the Report Manager and Web Service availability monitors: now the user can treat some status codes as healthy via the override.
Fixed the discoveries, now the last items can be undiscovered
Added timeout support for every non-native workflow
Simplified the dashboard to make it quicker and more informative
Reviewed and updated the Knowledge Base articles
Improved Run As mappings
Updated the discoveries to throw errors in case of some problems detected during the discovery
Updated the references and removed deprecated elements to support 6.6.4.0+ visualization library
Changed the performance rules write actions accounts to “Default Action account”
“Known Issues and Release Notes” section of the guide is updated
Fixed “Memory consumed by other processes (%)” rule having no Run As profile for DS; added SQL MP default Run As to the data source
Fixed “Failing replacement: $Data/Context/Property[@Name='<MonitorName>’]$” issue in OM log
New SQL Server 2005-2012 MP Features and Fixes
Fixed intermittent “Cannot login to database” alert with some rules
Added support for SQL Express Instances
Updated Knowledge Base articles
Microsoft SQL Server 2012 x86 on Windows 2008 R2: fixed the issue when DB file groups cannot be discovered
Win10 support: fixed “Cannot bind argument to parameter ‘Path’ because it is an empty string.” issue
Fixed issue when SQL Configuration Manager starts snap-in of wrong version
Fixed invalid Always On non-readable replica detection
New SQL Server 2014-2016 MP Features and Fixes
Fixed intermittent “Cannot login to database” alert with some rules
Fixed display string for AgentsGroup.Discovery
Added support of SQL Server Express Instances
Always On issue: Events “967” are no longer fired for File Group and Files discoveries when server has a non-readable DB
DB Discovery issue fixed: masterDB is to be used if the target is inaccessible
DBSize issue: filter < 0 values in provider, return data for fileSize
Win10 support: fixed “Cannot bind argument to parameter ‘Path’ because it is an empty string.” issue
Agent Job Discovery is now disabled by default
Fixed issue when SQL Configuration Manager starts snap-in of wrong version
Fixed invalid Always On non-readable replica detection
This posting will be part of my SCOM basics series and covers the key concepts of Objects and Classes.
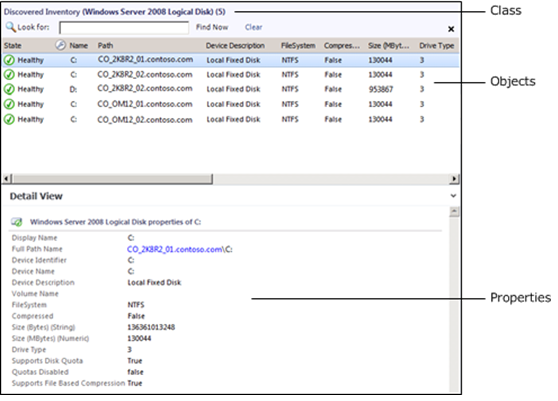
Objects
An object is the basic unit of management in Operations Manager. An object typically represents something in your computing environment, such as a computer, a logical disk, or a database. It could also represent something more abstract, such as an application, an Active Directory domain, or a DNS zone. An object can also be referred to as an instance of a particular Class.
Classes
A class represents a kind of object, and every object in Operations Manager is considered an instance of a particular class. All instances of a class share a common set of properties. Each object has its own values for these properties which are determined when the object is discovered.
Most management packs define a set of classes that describe the different components that make up the application that is being monitored and the relationships between those classes
Targeting
A target in the Operations console represents all instances of a particular class. For example, a viewlists all of the objects that are instances of the class that is used as the target class for the view, and a monitor is applied to all objects that are instances of the monitor’s target class.
Classes have two further categories. Base Classes and Hosted Classes
Base Classes
Every class in Operations Manager has a base class. A class has all the properties of its base class and could add more. All of the classes from the different management packs installed in your management group can be arranged in a tree with each class positioned under its base class.
When you select a class as a target that is a base class for other classes, the monitor or rule applies to all instances of each of those classes. For example, if you use Windows Operating System as the target for a monitor, then the monitor applies to all instances of Windows Client Operating System and Windows Server Operating System. This is because those two classes use Windows Operating System as their base class.
Hosted Classes
Most classes are hosted by another class. When one class hosts another, the hosting class is called the parent, and the class being hosted is called the child. Instances of the child class cannot exist without a parent.
For example, several classes are hosted by Windows Computer because they are components on a computer. It would not make sense to have a logical disk if there was no computer for the disk to be installed on. Therefore, Logical Disk is hosted by Windows Computer. This means that every instance of Logical Disk must have one instance of Windows Computer as its parent.
Note about Groups
I’ve included groups in this posting because it can be a common mistake to try and use a group as a target for a rule / monitor this can cause that rule / monitor to not function correctly as the class for a group only exists on a management server, the group will not be enumerated into it’s members from the target selection.
A management pack for windows 10 OS has been release, v10.0.0.0 is available here and is supported by System Center Operations Manager 2012 or higher.
Two types of client monitoring are available in this management pack:
· Aggregate client monitoring for gathering health information on the selected representative clients, and aggregating information for reports that display the trends
· Monitoring of mission-critical business clients
It is also important to note that agentless monitoring is not supported