Category Archives: Troubleshooting

SCOM: Monitoring a Fortigate Firewall

A while ago I had a request from one of my clients to monitor their new Fortigate Firewalls, as there is no existing management pack for this it required a bit of custom work.

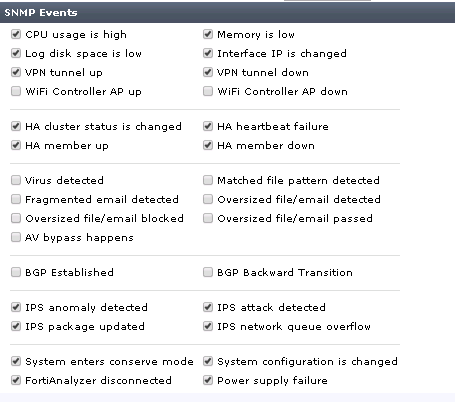
First on the firewall you’ll also need to configure SNMP, as well as what trap notifications will be sent.

snmptraps

Then discover the Fortigate using the standard network monitoring discovery.

This is the address for the Fortigate MIB file contents which you will need in order to map OIDs for the next part.

In SCOM create an SNMP Trap alerting Rule targeting the Node Class.

snmpalerting1snmpalerting2

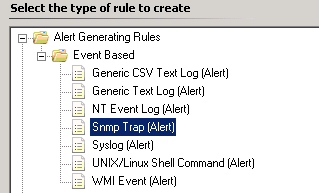
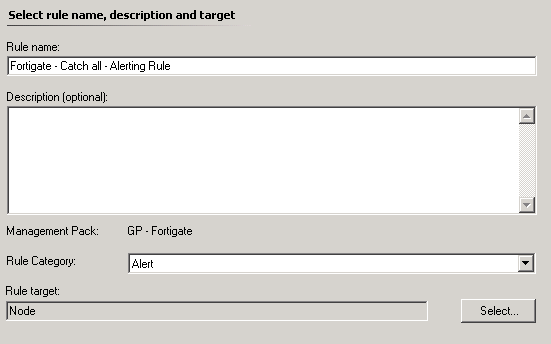
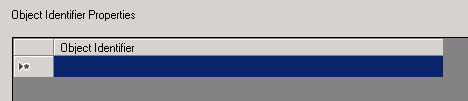
For now leave the OID properties filter empty
snmpalerting3

This rule will be used to identify any OIDs in the future that may be missing from your specific alerting rules.

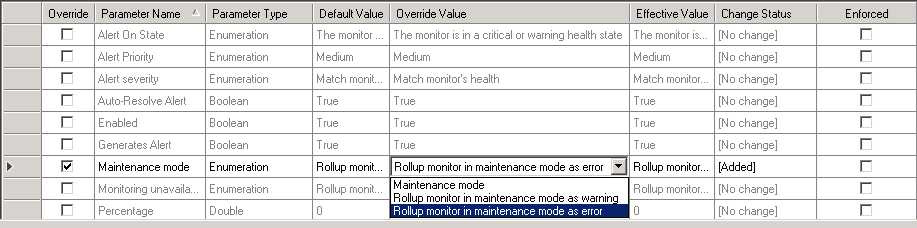
Now using the MIB list provided earlier each alert ticked in the Fortigate configuration needs to be mapped to the relevant OID and a specific alerting rule created for it, for example 1.3.6.1.4.1.12356.101.4.4.2.1.2 is the OID for HIgh Processor Usage. So in order to generate an alert for High CPU on the Fortigate you will need a rule with this specific OID in the filter 1.3.6.1.4.1.12356.101.4.4.2.1.2.

Repeat for each OID that you need to monitor and use the catch all to identify anything you may have missed.

Loading

XPost: Event 18054 errors in the SQL application log

Here is a great post by Kevin Holman addressing an issue you would come across if you have had to move your SCOM databases or recover them to a new SQL server.

Sample error:

Log Name:      Application
Source:        MSSQL$I01
Date:          10/23/2010 5:40:14 PM
Event ID:      18054
Task Category: Server
Level:         Error
Keywords:      Classic
User:          OPSMGR\msaa
Computer:      SQLDB1.opsmgr.net
Description:
Error 777980007, severity 16, state 1 was raised, but no message with that error number was found in sys.messages. If error is larger than 50000, make sure the user-defined message is added using sp_addmessage.

In essence this happens, as explain, due to the sysmessages being created in the master database on installation. These messages will then be missing after a database move or new sql server recovery.

Kevin has also provided a script to re-add these messages for you here – CAUTION for SCOM 2012 R2 only

Loading

SCOM: Alerting on Exchange 2013 Database Failover

As it turns out the Exchange 2013 MP will not be able to alert you should your Exchange 2013 databases fail over, this is by design, as Microsoft does not consider this condition to be an issue.

There is a great article by Scott at flobee.net which addresses this issue for Exchange 2010, it is quite simple to apply the same thinking for use with Exchange 2013. The event is the same, the target just needs to be Exchange 2013 server.

Screenshot-FailoverAlert2


Loading

SCOM: The System Center Management service terminated with service-specific error %%-2130771964

Just a quick issue which bares being noted.

A colleague of mine had an issue where the health service on one of his management servers would not start. The error displayed was “The System Center Management service terminated with service-specific error %%-2130771964″

The resolution is simple, rename the Health Service State folder and then start the service.

This issue is caused by corruption in the health service cache which is preventing the service from starting,

Loading

SCOM: Error in SNMP GET response from IP Address: Status: noSuchInstance(129)

Today I was addressing this error in the Operations Manager event log at one of my customers:

Error in SNMP GET response from IP Address: Status: noSuchInstance(129)

According to What Gets Monitored with System Center Operations Manager 2012 Network Monitoring this can be caused by several things:

Possible Resolutions

  • Stale Discovery Data – Device has been reconfigured since the last discovery and Operations Manager is attempting to monitor a component that no longer exists on the device.
  • If the device doesn’t support the workflow, then a solution is to disable the workflows utilizing the value for the device. This will prevent these workflows loading and failing in the future.
  • Possibly a device issue, try updating the Firmware and OS on the device
  • Possible a discovery issue where the instance is being discovered incorrectly.  For example Operations Manager is expecting to monitor a performance counter but this is a virtual interface and the counters are not present for the interface.  Try running a re-discovery for the device.

In my clients case the network devices in question did not respond to the information request of certain workflows.

I resolved the issue by creating a group and adding the ports which were not returning data to that group. Then I evaluated each of the event log errors for the name of the workflow that was executing the snmp get, see example below:

Log Name:      Operations Manager
Source:       Health Service Modules
Event ID:      11009
Error in SNMP GET response from IP Address: 10.11.11.1, Status: noSuchInstance(129).
One or more workflows were affected by this.
OID: .1.3.6.1.2.1.10.7.2.1.2.268
Workflow name: System.NetworkManagement.MIB2.NetworkAdapter.InputPacketBroadcastPct
Instance name: Port-37

There is a great reference at http://mpdb.azurewebsites.net which you can use to match up the workflow name to the corresponding rule or monitor. If I use the above example and search the page for System.NetworkManagement.MIB2.NetworkAdapter.InputPacketBroadcastPct I can see it correlates to a rule called Input Broadcast Packets Percentage (netcor) which I can override to turn off against the group I created earlier.

It can be a lengthy process and there are other causes which are easier to address so you will need to do some testing in each individual case.


Loading

Cross post: Quick note on an issue you might encounter after installing Microsoft Security Update 3004375

A potential issue has been highlighted on the Microsoft Operating Manager Engineering Blog.

“We’ve seen an issue relating to 3004375 that occurs due to a regression, and while it’s already been fixed (by installing 3023562), we wanted to take a minute and let you know about some of the details in case you happen to see it. ”

Full details are available here

Short version: If you have KB3004375 installed on your management servers you may need to install KB3023562


Loading

SCOM: Dashboards are blank when opened in a particular console

It’s always the bugs you come across when you are trying to do something else that can be the most frustrating. Today while creating some dashboards for one of my clients the views returned blank after saving them.

I then had a look at the SQL built in dashboards to see how widespread this issue was and had the same results. The dashboard pane was blank and the tasks also did not display.

dashie

First I tried restarting the console with the /clearcache command and this usually address display issues and had the same result.

I then tried a console on a different server and then I tested using the web console both loaded the dashboards properly . So I was dealing with a server issue or a profile issue.

A bit of research suggested that sometimes this problem can be caused by a corrupt .net installation. As this requires change approval in order to address I first tested the profile option by logging on to the same server, where I experienced the issue with another user account. This time the dashboards loaded correctly so it’s probably not a .net issue.

Considering that /clearcache didn’t work I wanted to first try and remove the momcache.mdb cache file located in C:\Users\<user account>\AppData\Local\Microsoft\Microsoft.EnterpriseManagement.Monitoring.Console in order to test all options before recreating the user profile.

After deleting momcache.mdb and re-opening the console all the dashboards now loaded correctly.

Loading

SCOM: Unable to view overrides in Authoring pane when no scope is selected.

An odd issue I encountered today at one of my customers that has recently completed a migration to SCOM 2012 R2, when trying to open the overrides node with no scope selected I got the following error “An object of class ManagementPackClass with ID <GUID Removed> was not found” and then the view shows 0 overrides until the console is reopened with a /clearcache.

Turns out this error is caused by having an override that references a class that no longer exists, in order to track it down you first have to access the overrides which you can no longer see unless you do the following:

1. Export your overrides to text file using poweshell by running get-scomoverride | out-file c:\SCOMOverrides.txt
2. Search the output text file for the GUID which was in the original error “An object of class ManagementPackClass with ID <GUID Removed> was not found
3. The GUID will appear on a line labeled Context, below that one look for a line labeled Identifier, In my case it looked as follows “Identifier: 1|Windows.Operating.System.Custom.Monitors”
4. Generally this is enough information to identify which management pack needs to be deleted if it is not then continue to step 5
5. In SQL run the following query, remebering to edit it for your Identifier, against your operationsmanager database select * from ManagementPack where ManagementPackSystemName like ‘Windows.Operating.System.Custom.Monitors’
6. Once you have identified which management pack is causing your issue it needs to be deleted, once the new configuration is processed you will be able to see your overrides again.

Solution provided by Mcirosoft on Technet forum

Loading

SCOM: A System Center service may not start after applying the update in KB2677070

An issue to keep an eye our for in your SCOM and SCSM envionments

This KB article contains 5 potential workarounds if you find yourself experiencing the below problem:

After applying the following update, the System Center Data Access service or the System Center Management Configuration service may fail to start with a time-out error.

2677070 – An automatic updater of revoked certificates is available for Windows Vista, Windows Server 2008, Windows 7, and Windows Server 2008 R2 (https://support.microsoft.com/en-us/kb/2677070/)

Also, after opening the Service Manager console the following error may be displayed:

Reporting Data Warehouse management Server is currently unavailable. You will be unable to view reports or administer the Data Warehouse until this server is available. Please contact your system administrator. After the server becomes available please close your console and re-open to connect.

Loading

SCOM: Cluster maintenance mode, resource groups and you

One of my colleagues brought an issue to my attention whereby placing a Cluster server into maintenance mode was causing a flood of  “Cluster resource or group offline or partially online” alerts from that clusters resource groups.

It turns out that the default maintenance mode setting for the Resource Group dependency rollup monitor is “Rollup monitor in maintenance mode as error”. This means that any objects rolling up as maintenance mode will cause the resource group monitor to go critical and generate “Cluster resource or group offline or partially online” alerts.

Changing the value to maintenance mode alleviates this issue. I’ve also has success placing the resource groups into maintenance mode before the cluster objects.

clusterb

Loading