Tag Archives: #SQL

SCOM: New SQL Management Pack 6.4.0.0

As of 2013-09-06 a new management pack has been released for SQL:

2013-09-12 Note: Issues are currently being reported with with this version of the SQL MP: Error ID 11052 “

  • Module was unable to convert parameter to a double value Original parameter:
    ‘$Data/Property[@Name=’CPUUsage’]$’ Parameter after $Data replacement: ‘-1.#IND’
    Error: 0x80020005 Details”

Download it here

Below is the new feature information from the site / guide, there are several new rules and monitors which offer a deeper look into your SQL environments:

      The Management pack for SQL Server provides the capabilities for Operations Manager 2007 R2 and Operations Manager 2012 to discover SQL Server 2005, 2008, 2008 R2, and SQL Server 2012. It monitors SQL Server components such as database engine instances, databases, and SQL Server agents.
      The monitoring provided by this management pack includes performance, availability, and configuration monitoring, performance data collection, and default thresholds. You can integrate the monitoring of SQL Server components into your service-oriented monitoring scenarios.
      In addition to health monitoring capabilities, this management pack includes dashboard views, diagram views and extensive knowledge with embedded inline tasks, and views that enable near real-time diagnosis and resolution of detected issues.

Important Prerequisite Notes:

      Clusters: In order to ensure that all monitoring works correctly for clustered instances of SQL Server ensure that your OpsMgr agents on the physical nodes of the cluster are running either OpsMgr 2007 R2 or OpsMgr 2007 SP1 with the most recent cumulative update for OpsMgr 2007 SP1 applied or OpsMgr 2012.

Feature Summary:

      The following list gives an overview of the features of the SQL Server management pack. Refer to the SQL Server management pack guide for more detail.

New features:

      • New Dashboard for SQL Server 2012 DB
      • New Monitors and Rules – only for SQL 2008 and SQL 2012
        • Collect DB Active Connections count
        • Collect DB Active Requests count
        • Collect DB Active Sessions count
        • Collect DB Active Transactions count
        • Collect DB Engine Thread count
        • Thread Count monitor
        • Transaction Log Free Space (%) monitor
        • Transaction Log Free Space (%) collection
        • Collect DB Engine CPU Utilization (%)
        • CPU Utilization (%) monitor for DB engine
        • Buffer Cache Hit Ratio monitor
        • Collect DB Engine Page Life Expectancy (s)
        • Page Life Expectancy monitor
        • Collect DB Disk Read Latency (ms)
        • Collect DB Disk Write Latency (ms)
        • Disk Read Latency monitor
        • Disk Write Latency monitor
        • Collect DB Transactions per second count
        • Collect DB Engine Average Wait Time (ms)
        • Average Wait Time monitor
        • Collect DB Engine Stolen Server Memory (MB)
        • Stolen Server Memory monitor
        • Collect DB Allocated Free Space (MB)
        • Collect DB Used Space (MB)
        • Collect DB Disk Free Space (MB)
        • SQL Re-Compilation monitor
      • Run As configuration changes to support Low privilege for SQL Server 2012 Cluster

Additional features:

    • AlwaysOn Monitoring
      • Automatically discover and monitor availability groups, availability replicas, and availability databases for hundreds of computers.
      • Health roll-up from availability database to availability replicas.
      • Detailed knowledge with every critical health state to enable faster resolution to a problem.
    • Seamless integration with Policy based management (PBM)
      • Auto-discover custom PBM polices targeting AlwaysOn and database components.
      • Rollup of health of policy execution within the SQL monitoring pack under extended health.
    • Support for Mirroring and Replication Monitoring (only applicable to SQL Server 2008 and 2008 R2 version of management pack)
      • Discover mirroring databases, witness, and mirroring group.
      • Monitor database mirror state, database mirror witness state, and mirroring partners’ state.
      • Custom diagram view to visually represent the primary and the mirrored databases.
      • Approximately twenty rules to detect replication events.
    • Improved Freespace monitoring with mount point support
    • Support for Enterprise, Standard and Express editions of SQL Server 2005, 2008, 2008 R2, and 2012 and 32bit, 64bit and ia64 architectures.
    • Support for both simple and complex SQL Server configurations such as clustered installations, multiple instances and 32bit roles running on a 64bit OS. For full details on supported configurations refer to the guide included with the management pack.
    • Discovery and monitoring of SQL Server roles such as DB Engine, Reporting Services, Analysis Services, Integrations Services.
    • Discovery of SQL Server components such as databases, the SQL Agent and SQL jobs.
    • Views covering areas such as database free space, SQL Server related performance, SQL Server related alerts, and lists of the various SQL Server roles and components which are discovered and their related state.
    • Discovery and basic monitoring for SQL Server Reporting Services and Integration Services.
    • Reports for longer-term analysis of common problem areas related to SQL Server such as SQL Server lock analysis and top deadlocked databases, SQL Server service pack levels across discovered roles, user connection activity. Likewise the generic reports from the Microsoft Generic Report Library can be used against the roles and components discovered by the SQL MPs to review availability and performance across many systems and over longer periods of time.
    • Role and component specific tasks which provide access to common tools, triage information, or corrective actions without needing to leave the Operations Console in most cases.
    • Monitoring of databases covers database status, database free space, log shipping monitoring for both the source and destination, and transaction log free space.
    • Monitoring of key SQL Server related services.
    • Monitoring for persistent SPID blocking.
    • Monitoring of numerous SQL Server events and performance data points. Alerts bring the issue to your attention and provide knowledge on the impact and possible resolutions.
    • A low-privilege configuration for discovery and monitoring that eliminates the need for SQL Server sysadmin, dbo, db_owner, and box admin privileges

Loading

SQL 2008 – Relocating log files

I needed to move our Data Warehouse and ACS database log files to a new drive, the following is a relatively simple method to move a SQL log file to a new location without needing to detach your database.

ALTER DATABASE DBNAME SET SINGLE_USER WITH ROLLBACK IMMEDIATE;
ALTER DATABASE DBNAME SET OFFLINE;
ALTER DATABASE DBNAME MODIFY FILE ( Name = Log File Name, Filename = ‘Drive Letter:\Log file location.ldf‘);
At this point copy the log file to the new location
ALTER DATABASE DBNAME SET ONLINE;
ALTER DATABASE DBNAME SET MULTI_USER;

The Log file name and file location can be found in the properties of your database under the File Tab.
This method could also be used to move your database file.

Loading

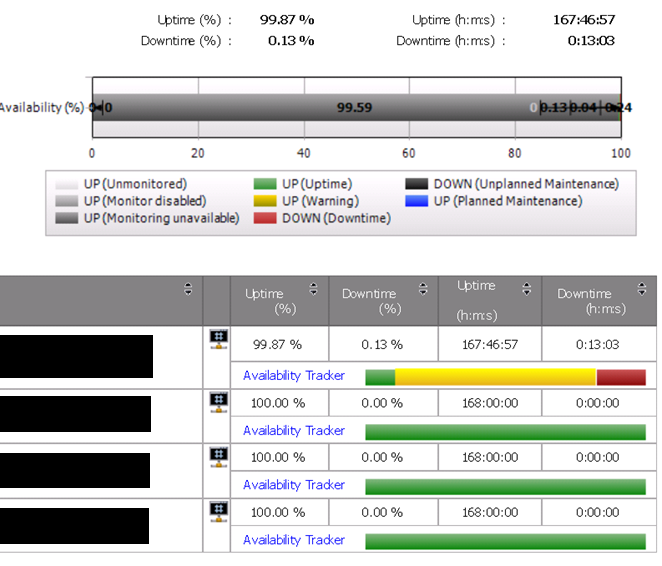
SCOM 2012 Availibility report bug – Bars display as dark grey Up (Monitoring unavailible)

Recently I came across an issue with SCOM 2012 availability reports which causes the bars at the top level to display incorrectly.

avalilibility drill down 2

This is due to an error which is causing a duplicate entry to be created in the HealthServiceOutage table which has an outage start time but not an outage end time which causes an incorrect availability calculation for those objects..

The following SQL query will allow you to identify if you are affected by this issue:

Step 1:

SELECT * FROM HealthServiceOutage HS1 JOIN HealthServiceOutage HS2

ON HS1.StartDateTime = HS2.StartDateTime

AND HS1.ManagedEntityRowId = HS2.ManagedEntityRowId

WHERE HS2.EndDateTime IS NULL AND HS1.HealthServiceOutageRowId <> HS2.HealthServiceOutageRowId

If this query returns any records make a note of the StartDateTime values in the duplicate rows this date will be used again later to correct the problem.

This issue is addressed in UR3 for SCOM 2012 SP1 but if you are not planning on rolling this out in the near future there is a private fix available from Microsoft which will correct the relevant stored procedure. Also as this is an acknowledged known issue Microsoft will not charge for any case to address this problem.

Once you have applied the fix you will need to use the following queries to add an outage end time to the duplicate entries and then re-aggregate the affected data.

As always before performing any database update operations, ensure to make a full backup of the OperationsManager and OperationsManagerDW databases.

Step 2:

This query will update the EndDateTime value from NULL to valid time stamp.

UPDATE HS2

SET HS2.EndDateTime = HS1.EndDateTime

FROM HealthServiceOutage HS1 JOIN HealthServiceOutage HS2

ON HS1.StartDateTime = HS2.StartDateTime

AND HS1.ManagedEntityRowId = HS2.ManagedEntityRowId

WHERE HS2.EndDateTime IS NULL AND HS1.HealthServiceOutageRowId <> HS2.HealthServiceOutageRowId

Once Step 2 has finished running you should re-run the query in Step 1 to make sure that there are no additional affected rows.

 Step 3:

This  query will set the DirtyInd value for all the rows in the specific time range from 0 to 1, making them eligible for re-aggregation. The start date will be the StartDateTime value noted in step 1, the end date should be todays date.

update StandardDatasetAggregationHistory

set DirtyInd = 1

where DatasetId = (Select Datasetid from Standarddataset where Schemaname = ‘state’)

and AggregationDateTime => ‘2012-21-01 00:00:00’

and AggregationDateTime < ‘2012-13-03 00:00:00’

Step 4:

Disable the Standard Data set Maintenance rule for the State data set ONLY, then run the below query to manually re-aggregate the State Data.

declare @i int

set @i=1

while(@i<=500)

begin

DECLARE @DataSet uniqueidentifier

SET @DataSet = (SELECT DatasetId FROM StandardDataset WHERE SchemaName = ‘State’)

EXEC standarddatasetmaintenance @DataSet

set @i=@i+1

Waitfor delay ’00:00:05′

End

Note: Thie query may need to be run multiple times depending upon the amount of data that need to be aggregated .

Step 5:

Once this query returns less then 5 rows Step 4 can be stopped and the Standard Data set Maintenance rule  can be re-enabled.

Select count(*) from StandardDatasetAggregationHistory

where Datasetid = (Select Datasetid from Standarddataset where Schemaname = ‘state’)

AND DirtyInd=1


In my case there were 741 rows that needed to be re-aggregated, on average it takes between 5 and 10 minutes for each row, which resulted in 105 hours total, although your mileage may vary depending on the power of your SQL server and how busy your environment it.

Loading

SCOM issue discovering SQL Instances / Databases


There appears to be an issue when trying to discover certain SQL 2008 instances with SCOM. Which is related to MOF data not being registered in the WMI repository correctly when SQL is installed.

The error that you will see in your Operations Manager event log is:

DiscoverSQL2008DBEngineDiscovery.vbs : The Query ‘select * from SqlService where SQLServiceType =’1” did not return any valid instances. Please check to see if this is a valid WMI Query.. Invalid class

I’ve had success with the below solution:

From an elevated command prompt, browse to the folder “C:\Program Files (x86)\Microsoft SQL Server\100\Shared”

Run mofcomp sqlmgmproviderxpsp2up.mof

Restart your SCOM Agent on the server.

Loading

Moving your OperationsManager database – SCOM 2012

Recently I had to move our OperationsManager database to a different server as part of testing a disaster recovery plan. While the Microsoft procedure for this (http://technet.microsoft.com/en-us/library/hh278848.aspx) is quite in-depth there is something to be aware of if you upgraded your environment from SCOM 2007.

Step 8 will ask you you to update the table dbo. MT_Microsoft$SystemCenter$ManagementGroup in your OperationsManager database however if you upgraded this table does not exist. Instead you will need to update the old SCOM 2007 management group table dbo.MT_ManagementGroup.

Step below:

Update the operational database with the new database server name.

  1. Open SQL Server Management Studio.
  2. Expand Databases, OperationsManager, and Tables.
  3. Right-click dbo. MT_Microsoft$SystemCenter$ManagementGroup (or dbo.MT_ManagementGroup if you upgraded from SCOM 2007), and then click Edit Top 200 Rows.
  4. Change the value in the SQLServerName_6B1D1BE8_EBB4_B425_08DC_2385C5930B04 column to reflect the name of the new SQL Server-based computer.
  5. Save the change.

Loading

Restoring SCOM databases

Recently I’ve had to recover a SCOM environment. This process required me to restore the SQL backups of both the OperationsManager and Data Warehouse databases.

After stopping the SDK service on our RMS, trying to restore the backup from the management studio under Tasks > Restore  > Database I came across a frustrating error “Exclusive access could not be obtained as the database is in use.”

A bit of research led me to an easier way to perform the restore, as well as check what is blocking the exclusive access,

First in SQL management studio select your master database and click new query:

USE MASTER
ALTER DATABASE DATABASENAME SET SINGLE_USER WITH ROLLBACK IMMEDIATE
GO

-This will make it so only one connection to the database can be made.
-Run the following command to see where any recurring connections to database are coming from.

EXEC SP_WHO2

-Check this list, looking under the DBName column.  If the database is listed, check the ProgramName, and HostName column to see who is attempting to connect.
-If it is not a service, or other application that would automatically reconnect which can be shut down, note the number in the SPID column to kill the connection, and immediately begin the backup.  Replace SPID below with just the number.

KILL SPID
RESTORE DATABASE DATABASENAME FROM DISK = ‘X:\PATHTO\BACKUP.BAK’
GO

-If this completes successfully, we can set the newly restored database back to multi user mode.

ALTER DATABASE DATABASENAME SET MULTI_USER WITH ROLLBACK IMMEDIATE
GO

After restoring your OperationsManager database you will also have to re-enable your SQL Broker as it is required in order for your SCOM discoveries to work.

To check if your SQL broker is enabled run the following query, returning a value of ‘0’ means that the Broker is disabled.

SELECT is_broker_enabled FROM sys.databases WHERE name='OperationsManager'

To enable the Broker user the following queries:

ALTER DATABASE OperationsManager SET SINGLE_USER WITH ROLLBACK IMMEDIATE
ALTER DATABASE OperationsManager SET ENABLE_BROKER
ALTER DATABASE OperationsManager SET MULTI_USER


Loading