Another update for the SQL Community Technical Preview management packs this time we have updates for the SQL Server MPs and no changes to the dashboards. Get the MPs here.
SQL Server 2014 / 2016:
Disabled Memory-Optimized Data Garbage Collection Fill Factor monitor and rule by default
Disabled Memory-Optimized Data workflows for all SQL Server instances, except for Developer, Enterprise, and Evaluation editions
Fixed issue: CPU Usage monitor & rule did not work for SQL Server cluster instance
Fixed issue: connection to an SQL Server instance was not closing when the destination was wrong
Made detection condition stricter for DB User Policy event-based discovery: added management group name
Made detection condition stricter for Script Failed alerting rule: added management group name
SQL Server 2008 / 2012
Added support for databases stored on SMB Shares
Fixed error logging in a script for Blocking Sessions monitor
Removed from the installer SQL 2005 MP files as no longer supported
Fixed issue: CPU Usage monitor & rule did not work for SQL Server cluster instance
Fixed issue: connection to an SQL Server instance was not closing when the destination was wrong
Fixed Non-Readable Replica detection (Always On)
Made detection condition stricter for DB User Policy event-based discovery: added management group name
Made detection condition stricter for Script Failed alerting rule: added management group name
An update for the Azure MP technical preview has been releasd and is available here
New in this version
Fixed issue: due to deadlock of Storage Account Capacity Probe threads, Storage Account Size Performance Collection rule did not work, and the corresponding performance counters were not collected
Fixed issue: service type page did not display all instances in the authoring wizard when there were more than 1000 instances
Fixed issue: storage account state view did not display non-classic storage accounts
Fixed performance stability issue observed while monitoring large subscriptions (1000+ objects): all MP components (objects monitoring, objects discovery and counters collection) did not work.
Fixed issue with “Add subscription” wizard pertaining to China subscriptions; added a corresponding guidance regarding the required user activity for China subscriptions monitoring, see the corresponding Note
Updated information about Run As Profiles configuration: Run As Profile Proxy is to be configured manually; see Security Configuration section for details
Over at NiCE they’ve released an update for their Oracle MP, version 4.00 has the below improvements and you can get more information here. Including how to join their webinar on September 7th, 4pm UTC+1.
New with this Release The following changes have been implemented for this release:
Improved Oracle Real Application (RAC) Monitoring
Oracle Service Monitoring
Over 50 new monitors and 50 new performance counters
Ease of use: Easy adding new instance to Monitoring
Collection scheduler: Performance and usability improvements
After many iterations of community previews there is now a non-preview release of the SQL management packs they can be downloaded from the below locations:
Due to the many issues with some of the recent versions of the SQL management packs I would strongly advise extensive testing before deployment to production systems.
SQL Server 2016 v6.7.2.0 – here SQL Server 2014 v6.7.2.0- here SQL Server 2005 / 2008 / 2012 v6.7.2.0- here SQL Server 2016 Analysis Services v6.7.2.0- here SQL Server Dashboards v6.6.7.6 – here SQL Server 2016 Replication v6.7.2.0- here SQL Server 2014 Replication 6.6.4.0 – here SQL Server 2012 Replication v 6.7.2.0 – here SQL Server 2008 Replication v6.7.2.0 – here SQL Server 2016 Reporting Services (Native Mode) v 6.7.2.0- here
Changes and Fixes
SQL Server Replication
Decreased database timeout value for some workflows to match new connection logic
Updated the visualization library
SQL Dashboards
Changed some stored procedures to improve Dashboards performance
SQL Server 2005 / 2008 / 2012 / 2014
Added rules for alerting when an Availability Replica changed its role and/or a Database Replica changed its role
Created a group for WOW64 SQL Server instances and disabled launching of some workflows for these instances
Added MP version line into MP’s events generated by the scripts
Fixed the display strings and Knowledge Base articles
Fixed issue: some scripts were not returning data when one of the few installed instances was stopped
Fixed issue: SPN configuration monitor used stale data
Fixed: mirroring monitoring scripts were failing when the instance was stopped
SQL Server 2016
Changed EventID for MP events generated by the scripts (became 4202 for the Always On scripts and 4211 for the others)
Disabled Memory-Optimized Data workflows for SQL Server 2016 Express
Added new performance rules for Always On Log Apply Pending/Ready Queue counters
Added rules for alerting when an Availability Replica changed its role and/or a Database Replica changed its role
Added MP version line into MP events generated by the scripts
Fixed the display strings and Knowledge Base articles
Fixed issue: some scripts was not returning data when one of the few installed instances was stopped
Fixed issue: SPN configuration monitor used stale data
Run As profiles are now presented in GPMP library and ready to become generic profiles for all SQL Server MPs starting with 2016
Fixed issue: mirroring monitoring scripts were failing when the instance was stopped
SQL Server Analysis Services and Reporting Services (Native Mode)
Updated the visualization library
Run As profiles are now presented in GPMP library and ready to become generic profiles for all SQL Server MPs starting with 2016
The Exchange Server 2013 management pack documentation has been updated and is available for download here.
New in this version
Updated supported configuration to include Exchange Server 2016. References to Microsoft Exchange Server 2013 functionality in this guide apply equally to Microsoft Exchange Server 2016.
Note: The management pack will not group or monitor servers running Exchange Server 2016 separate from Exchange Server 2013 in console UI elements, or reporting.
This posting is a follow on in my SCOM basics series.
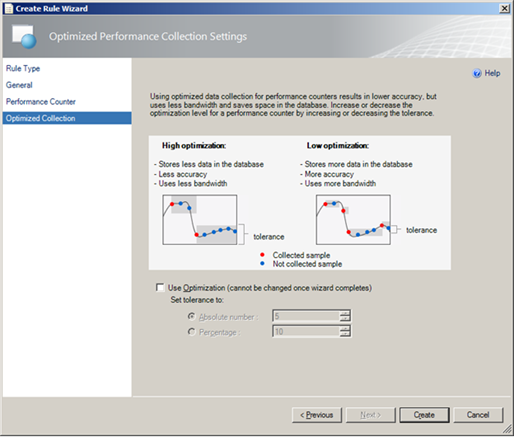
Lets start with what is Optimized Collection?
Optimization for a collection rule only collects a value if it differs from the previous sample by a specified tolerance. This is used to reduce network traffic and the amount of data stored in the Operations Manager database.
How does this affect me?
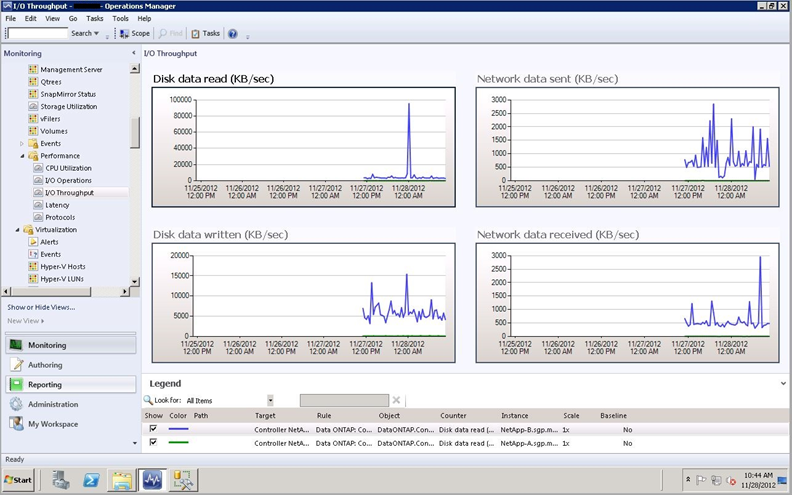
When viewing performance data you need to bear in mind that if the collection rule has optimization enabled then you may see gaps in your graphs if the value has not changed significantly for some time. The below image is an example of how this might look:
Note: Optimization should be used for performance counters that are expected to only change gradually. For counters that are expected to vary significantly from one value to the next, optimized collection should be disabled.