Tag Archives: Azure

Azure Managed Grafana

Recently announced the preview for Azure Managed Grafana is now available. For those who maybe don’t know Grafana is an observability platform which lets you create mixed data dashboards form a variety of sources.

And now you can run it in Azure!

Lets get started

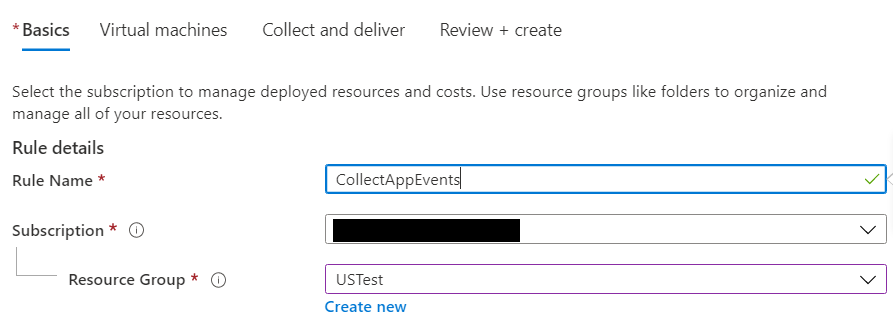
First you need to create a Grafana workspace, in the Azure Portal search for Azure Managed Grafana select it and click +Create. Fill out all the usual suspects, choosing your subscription, resource group, location and workspace name.

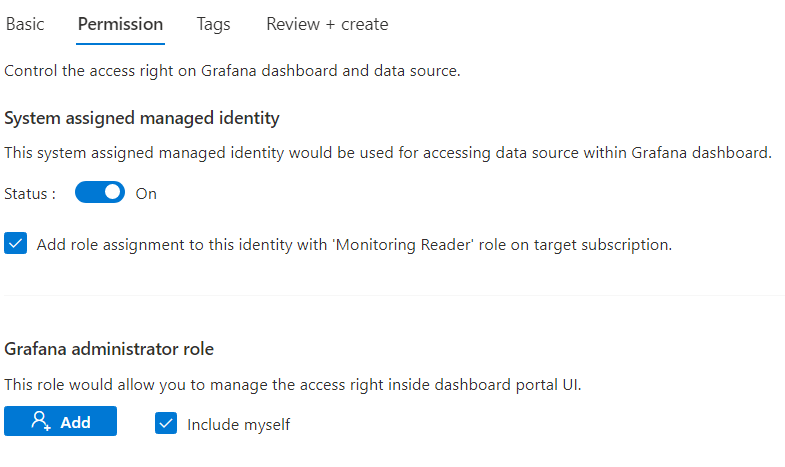
On the following tab create a managed identity as this is the way Grafana will be able to access data from your resources. Then create your workspace.

Next we need access

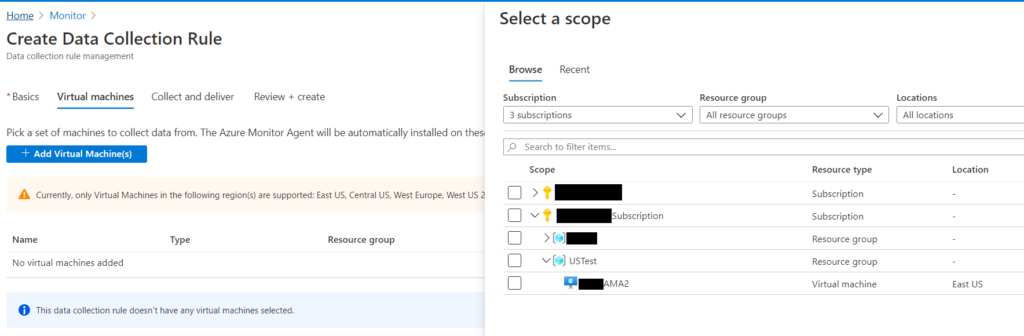
Grafana needs access to the resources you want to build dashboards for, you can easily do this with Azure RBAC and it can easily be done at the resource group or subscription level as well.

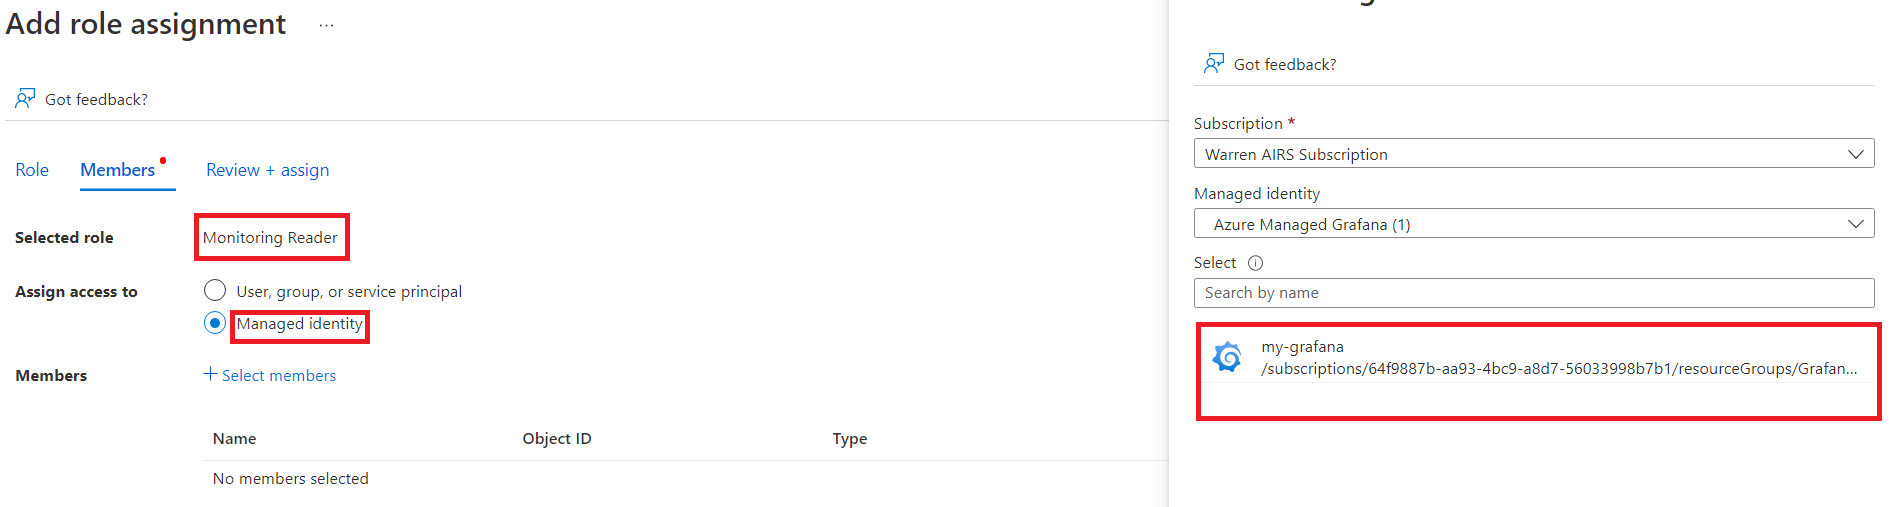
Using Access Control (IAM) give Monitoring reader access to the Managed Identify you created as part of your Grafana workspace

Lets make some dashboards

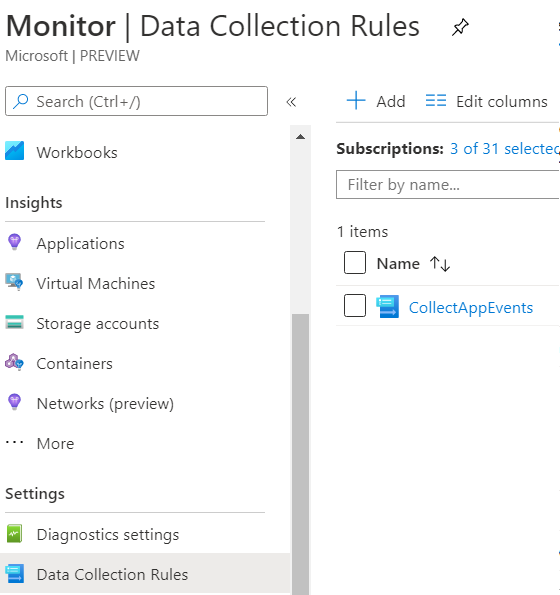
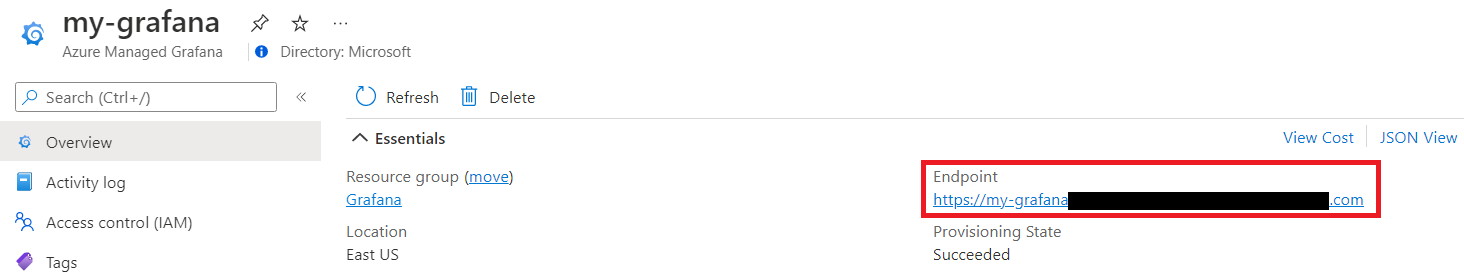
First lets open our Grafana, navigate to the workspace previously created and click on the endpoint address on the Overview blade

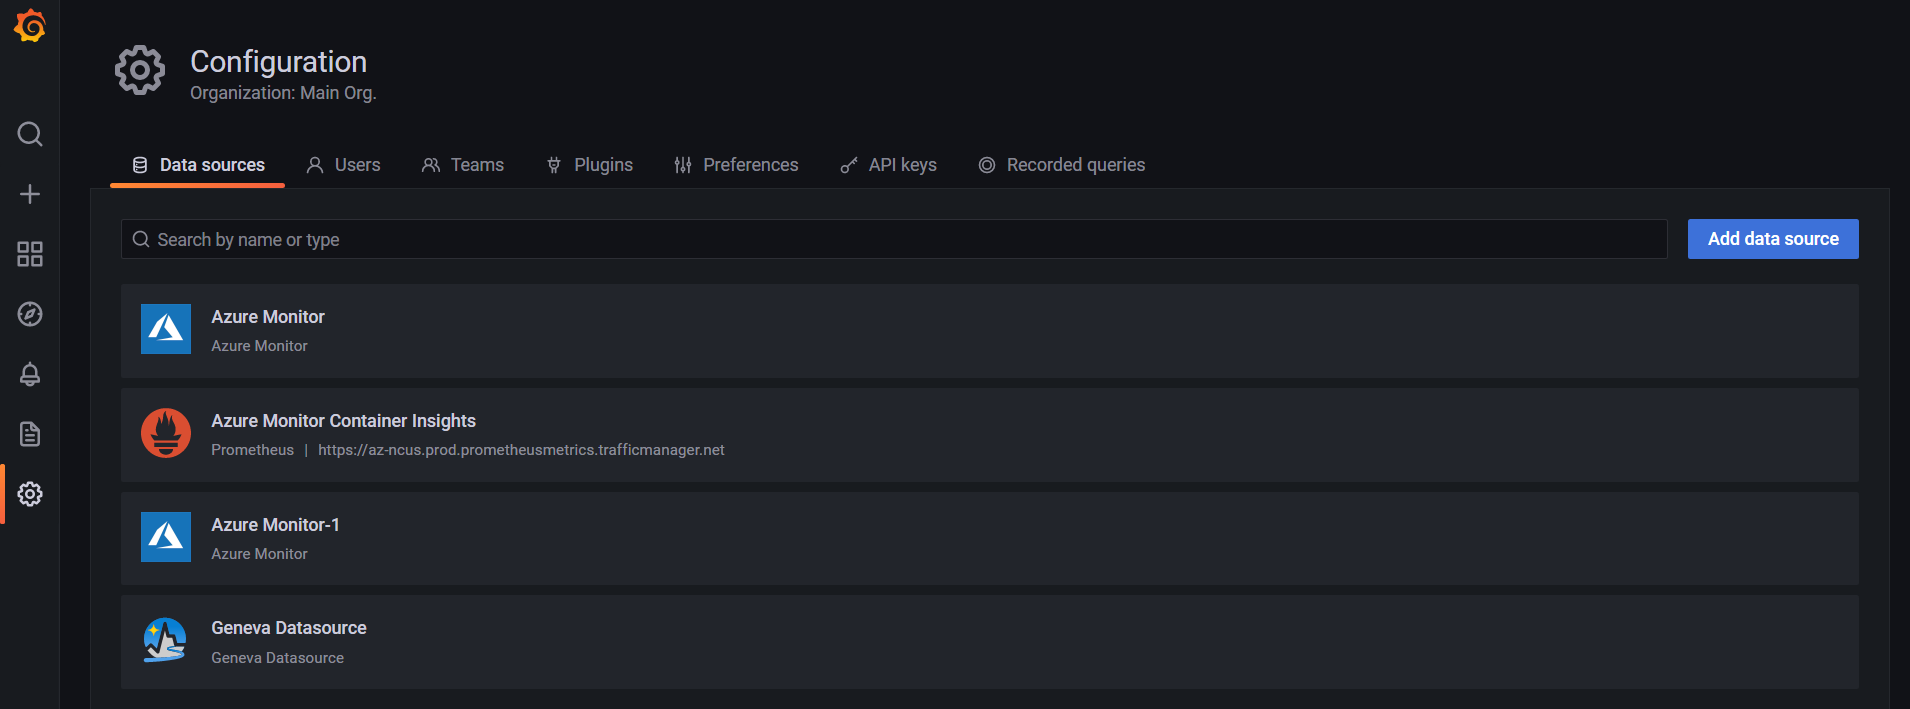
On the landing page there’s a notification to configure a data source. We’ll be using Azure Monitor, simply click add data source and choose Azure Monitor from among all of the available options, we can see here that there are plenty to choose from which is part of the power of Grafana.

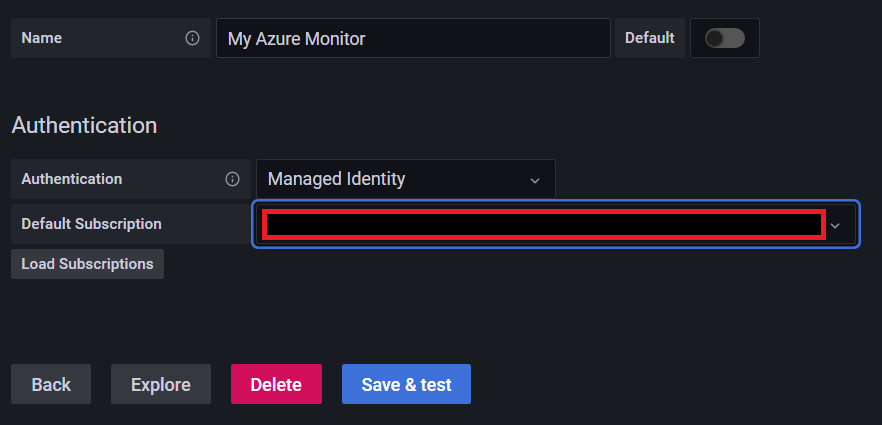
Name your connection, choose managed identify and select the relevant subscription. Then click Save & test

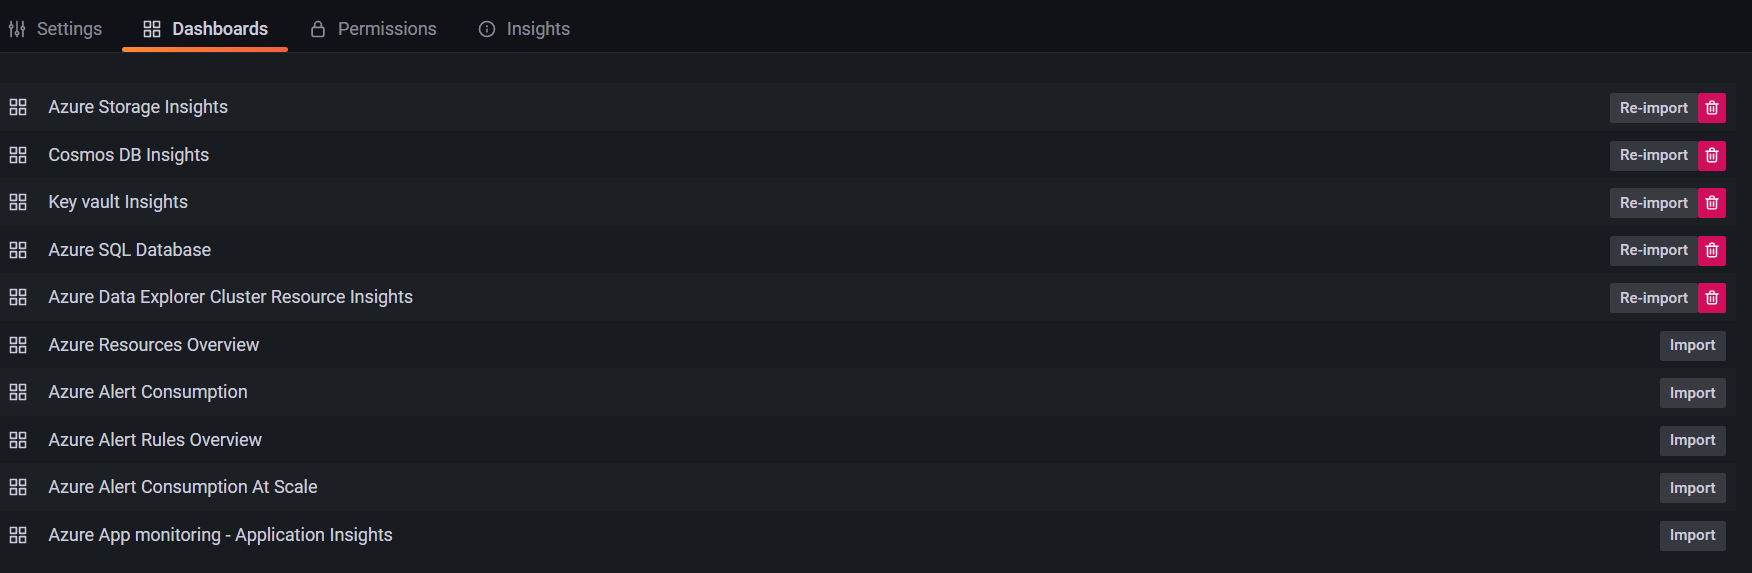
A nice feature is the ability to access pre-built dashboards out of the box, clicking on the Dashboards tab shows us several options which we can import with the click of a button.

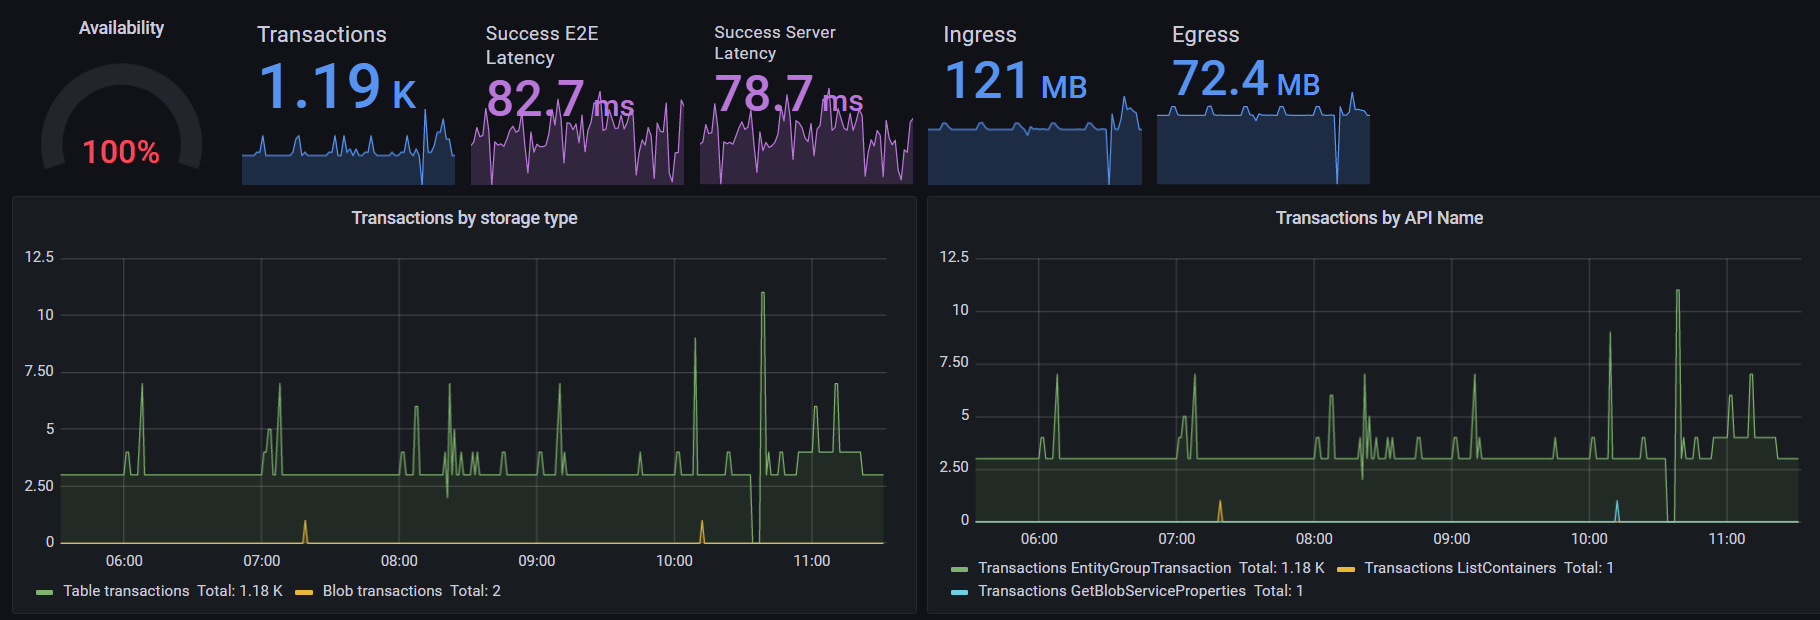
And we’re all set below is an example of the Azure Storage Insights dashboard which I was able to configure from start to finish in less than 5 minutes.

Overall, Azure Managed Grafana is very cool and offers an alternative approach to mixed data dashboards from a variety of sources. Of course, you can also create customized visuals and there are plenty of options to ensure you end up with something meaningful and perfect for your needs. I’m looking forward to seeing this go GA.

Happy dashboarding!

See the source image

Loading

Calling a Logic App from an Azure Monitor workbook!

Workbooks have a couple of new action types which let you do some very cool things. The one I’m going to focus on now is called ARM actions and this is some amazing stuff , if you thought workbooks were powerful before then watch this space!

Arm Actions

First ARM actions can be used to call various Azure actions against a resource. In the example workbook you can Start and Stop a website which is quite useful as you can do it directly from the workbook without having to navigate to the Resource Blade.

This uses a parameter to fetch the site name and pipes it into an ARM action of Start

Calling a Logic App

Super cool and very useful. Now lets look at how we can up our game a little bit. Using this same method you can actually call a Logic App, this is slightly more complex as you need to have the ARM Action path to said Logic App which looks like this:

/subscriptions/{Subscription:id}/resourceGroups/{RG}/providers/Microsoft.Logic/workflows/<LogicApp Name>/triggers/manual/run?api-version=2016-06-01

Note the various parameters and you can also parametrize the Logic App name, I have it hardcoded in this example. Also note in this case the trigger type is manual, this because the Logic App trigger is “When an HTTP request is received” and I am sending a JSON payload from the worbook to the Logic App.

You can also specify other triggers for Request, Recurrence and API Connection.

Now what can you do with this? Well as you might imagine the possibilities are endless, in my case I’m calling the Logic App to populate a secondary set of App data into Log Analytics to add more scope to the original workbook.

Once the Logic App has been run the App Info column changes to Populated and the GetAppDetails prompt changes to Refresh, the data is then made visible in a second grid below.

Conclusion

I’m very excited by the world that has opened up with this type of advanced workbook essentially turning them from an awesome visual tool into an awesome manageability tool.

If you ‘ve made use of this functionality I’d love to hear from you.

That’s all for now, happy workbooking!

Loading

Monitoring data from an API with Azure Monitor aka. Monitoring Endpoints with Sentinel

I was recently afforded a very interesting opportunity to help extend the reporting capability of Microsoft Defender, the end result used a combination of a logic app and a workbook to achieve something that is quite awesome (even if I do say so myself). Huge thanks to Jason Baxter and Hesham SaaD for their part in this.

It is worth noting that while this particular case used Sentinel you can achieve the same with Azure Monitor and a standard logic app, the choice will come down to whether or not the data is security related.

Now while the full details of the solution can be found here. I wanted to take a brief moment to talk about the power of the framework for this solution which can be broken down into key components.

  1. An API – now lots of applications have easily accessible monitoring data, however some don’t and there is often a wealth of information to be found with a web call to an API endpoint.
  2. A logic app – getting data from an API to log analytics may seen complex but using a logic app offers a low code approach which can meet most solutions needs. In the event of scaling it is also possible to use PowerShell and Azure functions to achieve a move robust result.
  3. A Workbook – As some of you may know I am a huge proponent of workbooks, they offer interactivity and flexibility while being easy and quick to create (more on that here), and you can of course also alert on the data once it’s in your Log Analytics workspace or even use PowerBI to further enrich your visuals.

The possibilities are literally endless, in the last week alone I’ve been asked to adapt this method monitor elements of other products such as Microsoft Teams. This a great method to keep in the back pocket and I’d love to hear from anyone who’s using it or something similar.

Pricing - Azure Monitor | Microsoft Azure

Loading

Protect your Azure subscription IDs when presenting

I came across a great browser extension a while ago called Azure Mask. I’ve been following the development of it closely because for a while it didn’t work with Edge. That issue is now fixed so lets have a look.

Azure mask does exactly what it says on the tin, it will mask your Azure subscription IDs and make them appear blurred out, this is a great tool for anyone presenting or screen sharing in Azure.

Looking at the below you can see exactly that

There’s even a hand toggle to easily turn the mask on and off

Azure Mask is available for Chrome (so it works on Edge) and Firefox and is available here from GitHub big kudos to developer Brian Clark

Loading

What Windows Event Logs am I collecting in Azure Monitor Logs?

With Event Log collection in Azure Monitor Logs (Log Analytics), if the log name is too long you can’t see the full name in the UI and it can be tricky to check what the log is.

Especially if you don’t have data yet.

Here’s a quick script using Get-AzOperationalInsightsDataSource that will display the event logs you are collecting.

$RG = "Resource Group Name"
$WS = "Workspace Name"

$Log = Get-AzOperationalInsightsDataSource -Kind WindowsEvent -ResourceGroupName $RG -WorkspaceName $WS

$Log.Properties.EventLogName

Loading

Azure Monitor Agent (AMA) goes preview

The new Azure Monitor Agent, is available for preview in the Azure Portal, lets have a look at how to configure data collection for this new experience.

If the Azure Monitor blade there are a couple of changes, we’re interested in the new option called Data Collection Rules this is how we’ll tell out new agent what data to collect.

Clicking new we can see there’s a few tabs to configure, under Basics, we need to name our rule, choose a subscription and resource group.

Next we need to choose the Virtual Machines we can to add to the rule, this will also deploy the agent to the VM if necessary. Note that due to the agent being in preview that it is not available in all regions currently.

Below the selected machines are all set and ready to go.

Finally we need to configure what this rule is collecting, you can choose logs or metrics and you can be more granular then before when it comes to log collection with a custom filter.

You can also have log and metrics collections in the same rule.

Once everything is configured simply click create, the agent will be deployed if necessary and the collection will start.

Easy as pie, enjoy the new monitoring experience!

Loading