Category Archives: Uncategorized

How to: Parameters with Azure Monitor Workbooks and a quick start template

Adding parameters to a workbook allows you to change values in your queries such as workspace without having to manually edit the query. This makes workbooks much easier to use and widens the potential audience.

Lets look at how to add parameters, some common ones and a little cheat sheet I use to quickly start a new workbook.

Adding Parameters

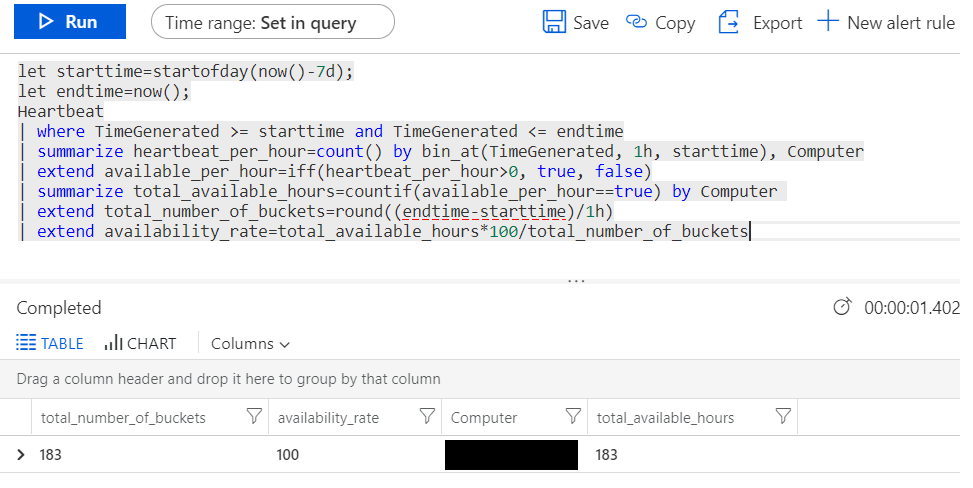
Parameters can be added into a KQL query by including the parameter name in braces, for example if I have a parameter for Time I can reference it in my KQL query as {Time}

There are currently four different supported parameters:

Text – An editable text box
Drop Down – Choose from a defined set of values
Time Range Picker – Choose from a predefined set of time range values
Resource Picker – Choose from resources selected for the workbook

Example Parameters for our Quick Start Template

Time

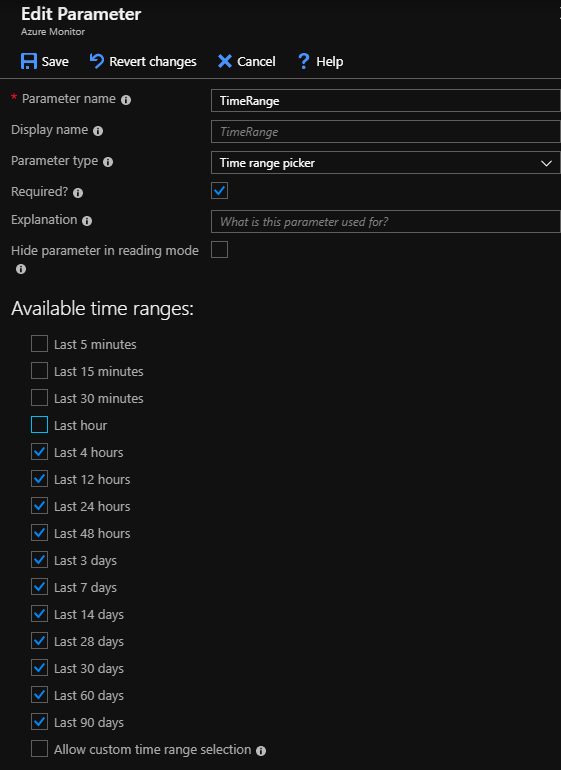
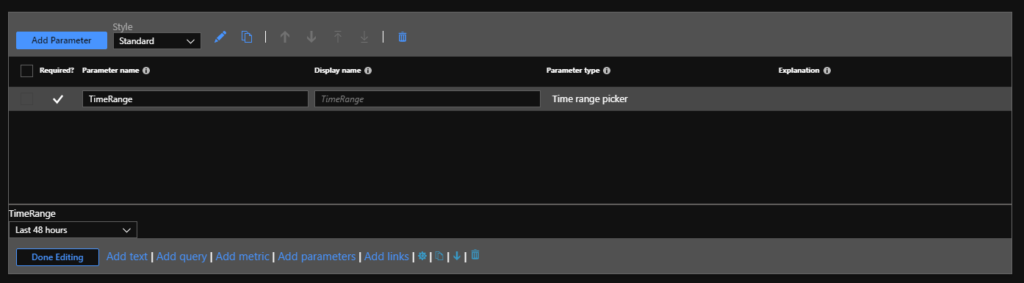
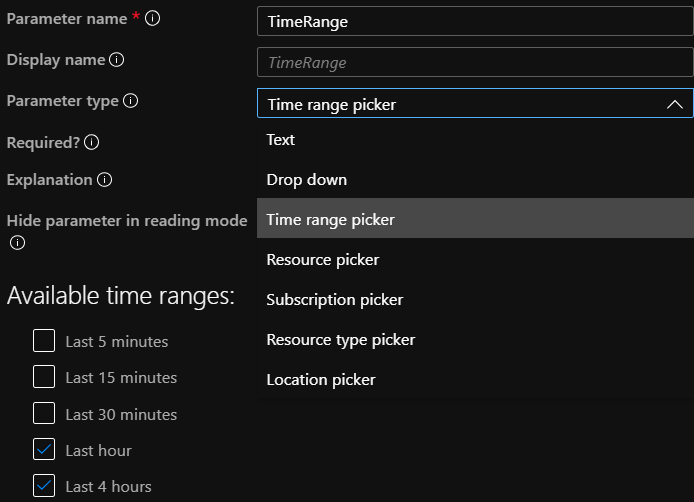
Adding a time parameter is relatively straight forward as it is a pre-defined parameter type, click add parameter and give it a name, select Time range picker from the type field and select the times ranges you want to be available. Then click Save

Subscription

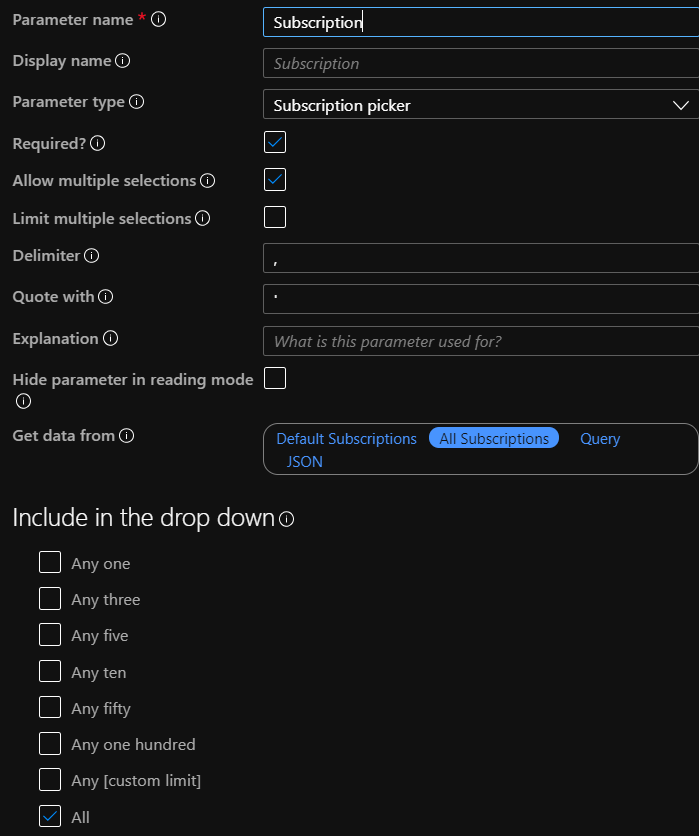
Adding a subscription parameter is very useful as it allows your workbook to be able to query across subscriptions easily. After giving the parameter a name, choose Subscription picker from the type. Tick Allow multiple selection and also include the All option below then
you can select from Default Subscriptions and All Subscriptions. Then click save.

Workspace

Workspace is useful for the same reasons Subscription is, this will allow a workbook to easily query across multiple workspaces from a single location.

This one is a little more complex to configure as it you’ll need to reference the workspaces through a KQL query, there are several ways to do this and i’ll share the one I am currently using.

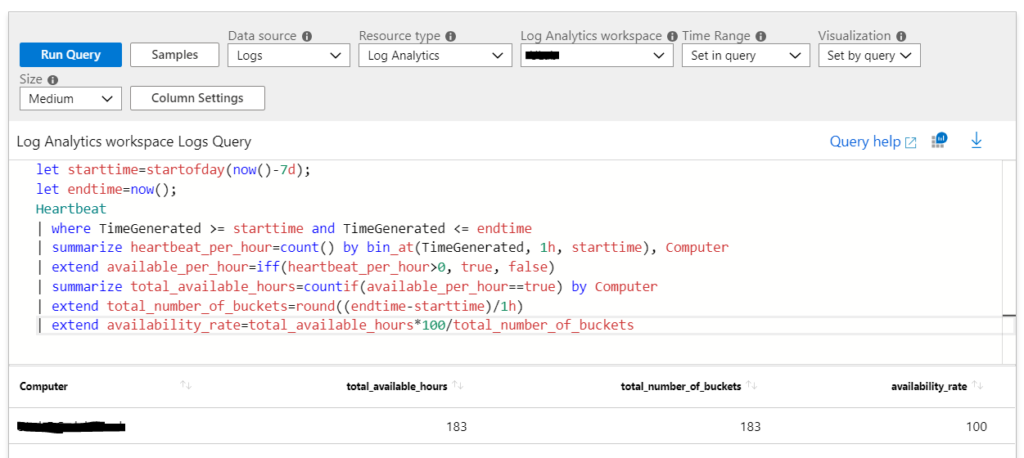
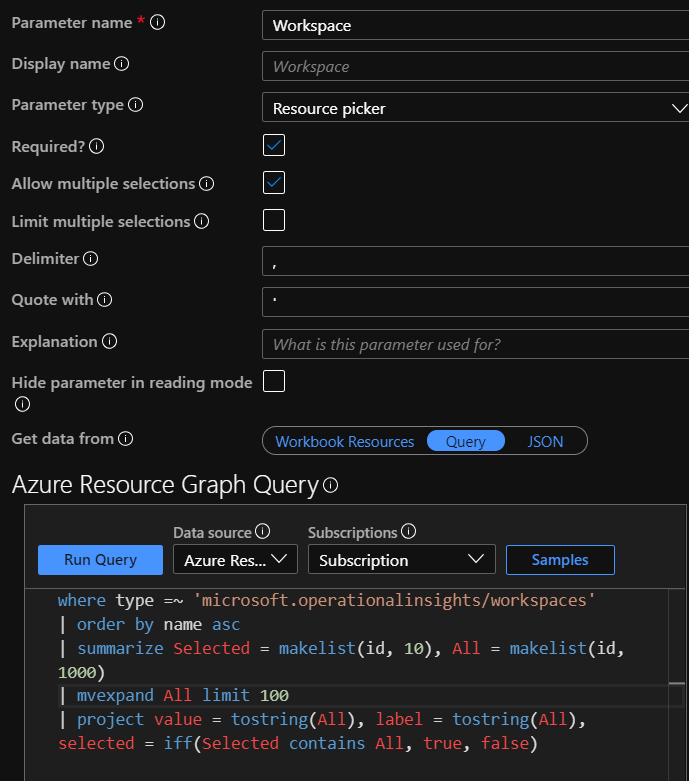
As before name your parameter, this time choose Resource picker, allow multiple selection and All as options and then select Get data from Query, set your source to Azure Resource Graph and Subscription, the query I use is below:

where type =~ ‘microsoft.operationalinsights/workspaces’
| order by name asc
| summarize Selected = makelist(id, 10), All = makelist(id, 1000)
| mvexpand All limit 100
| project value = tostring(All), label = tostring(All), selected = iff(Selected contains All, true, false)

Servers

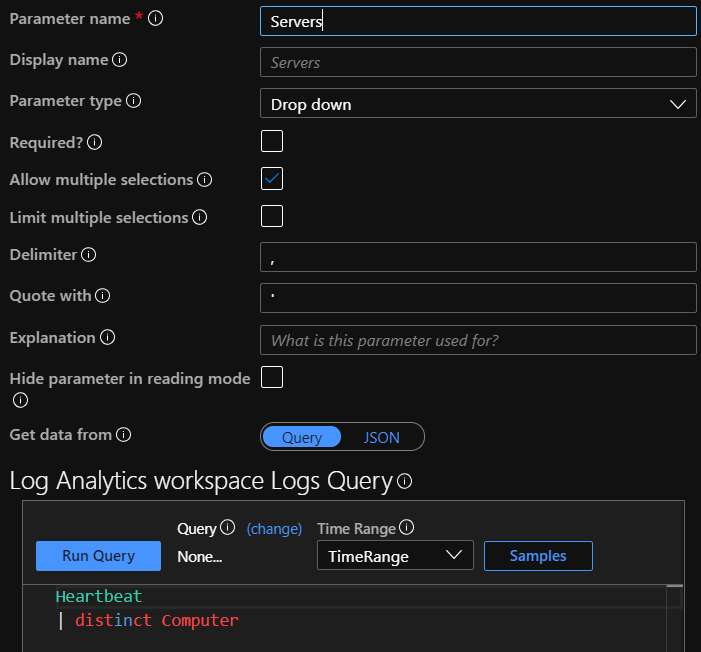
Not all Workbooks will require Servers but I use it often enough that I include in my Quick Start Template. This time choose Drop down, as before allow Multiple selection and All. We are going to populate our list from a query and a simple way to get a list of Servers is:

Heartbeat
| distinct Computer

Once you have saved this workbook with your populated parameters it is now a simple matter to reuse this every time we want to create a new workbook with parameters. All you need to do is edit this one and Save As to start a fresh workbook with pre-done parameters.

Json Template

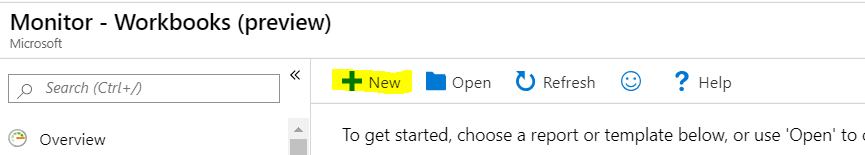
Below is the template to create your own easy quick start workbook, just create a blank one and paste the json code into the Advanced Editor in the Gallery Template section and click apply.

{
“version”: “Notebook/1.0”,
“items”: [
{
“type”: 9,
“content”: {
“version”: “KqlParameterItem/1.0”,
“query”: “”,
“crossComponentResources”: [
“{Subscription}”
],
“parameters”: [
{
“id”: “ff24505c-2099-43a4-a8a3-3456bed78eb5”,
“version”: “KqlParameterItem/1.0”,
“name”: “TimeRange”,
“type”: 4,
“isRequired”: true,
“value”: {
“durationMs”: 604800000
},
“typeSettings”: {
“selectableValues”: [
{
“durationMs”: 3600000
},
{
“durationMs”: 14400000
},
{
“durationMs”: 43200000
},
{
“durationMs”: 86400000
},
{
“durationMs”: 172800000
},
{
“durationMs”: 259200000
},
{
“durationMs”: 604800000
},
{
“durationMs”: 1209600000
},
{
“durationMs”: 2419200000
},
{
“durationMs”: 2592000000
},
{
“durationMs”: 5184000000
},
{
“durationMs”: 7776000000
}
]
}
},
{
“id”: “bfe50469-7469-4c4d-a33e-0edbb43546c4”,
“version”: “KqlParameterItem/1.0”,
“name”: “Subscription”,
“type”: 6,
“isRequired”: true,
“multiSelect”: true,
“quote”: “‘”,
“delimiter”: “,”,
“value”: [
“value::all”
],
“typeSettings”: {
“additionalResourceOptions”: [
“value::all”
],
“includeAll”: true
}
},
{
“id”: “fb861784-4609-49f2-9f58-427fcc547677”,
“version”: “KqlParameterItem/1.0”,
“name”: “Workspace”,
“type”: 5,
“isRequired”: true,
“multiSelect”: true,
“quote”: “‘”,
“delimiter”: “,”,
“query”: “where type =~ ‘microsoft.operationalinsights/workspaces’\r\n| order by name asc\r\n| summarize Selected = makelist(id, 10), All = makelist(id, 1000)\r\n| mvexpand All limit 10000\r\n| project value = tostring(All), label = tostring(All), selected = iff(Selected contains All, true, false)”,
“crossComponentResources”: [
“{Subscription}”
],
“value”: [
“value::all”
],
“typeSettings”: {
“resourceTypeFilter”: {
“microsoft.operationalinsights/workspaces”: true
},
“additionalResourceOptions”: [
“value::all”
]
},
“timeContext”: {
“durationMs”: 0
},
“timeContextFromParameter”: “TimeRange”,
“queryType”: 1,
“resourceType”: “microsoft.resourcegraph/resources”
},
{
“id”: “b2627475-cef7-4e91-97b9-b70bf00164e6”,
“version”: “KqlParameterItem/1.0”,
“name”: “Servers”,
“type”: 2,
“multiSelect”: true,
“quote”: “‘”,
“delimiter”: “,”,
“query”: “Heartbeat\r\n| distinct Computer”,
“crossComponentResources”: [
“{Workspace}”
],
“value”: [
“value::all”
],
“typeSettings”: {
“additionalResourceOptions”: [
“value::all”
]
},
“timeContext”: {
“durationMs”: 0
},
“timeContextFromParameter”: “TimeRange”,
“queryType”: 0,
“resourceType”: “microsoft.operationalinsights/workspaces”
}
],
“style”: “pills”,
“queryType”: 1,
“resourceType”: “microsoft.resourcegraph/resources”
},
“name”: “parameters – 1”
}
],
“styleSettings”: {},
“$schema”: “https://github.com/Microsoft/Application-Insights-Workbooks/blob/master/schema/workbook.json”
}

Loading

How to: Availability Workbook for Azure Monitor

Azure Monitor workbooks are very powerful and a great addition to the Monitor toolset you can learn more about them in my article here. Today we’ll be using Workbooks to create an availability report for our servers.

First we need our query, below is a fairly stock example of how to use the Heartbeat table to get the number of hours a server has been online and compare that to a set number of hours, in this case the past 7 days (168 hours) and work that out as a percentage.

let starttime=startofday(now()-7d);
let endtime=now();
Heartbeat
| where TimeGenerated >= starttime and TimeGenerated <= endtime
| summarize heartbeat_per_hour=count() by bin_at(TimeGenerated, 1h, starttime), Computer
| extend available_per_hour=iff(heartbeat_per_hour>0, true, false)
| summarize total_available_hours=countif(available_per_hour==true) by Computer
| extend total_number_of_buckets=round((endtime-starttime)/1h)
| extend availability_rate=total_available_hours*100/total_number_of_buckets

As you can see running this query against your Log Analytics workspace will return exactly that, The Computer name, the total number of hours or “buckets”, the number of available hours and the percentage or Availability rate.

Once we have a working query it’s time to create our workbook, this can be done under the Azure Monitor blade of the Azure console, simple click on Workbooks which is still in preview and then click new.

Click add query and configure your workspace as shown below, then click Run Query

So far so good, now we want to be able to select the time range for our availability report. to do this click add Parameters at the bottom of the editor. Conveniently there is a pre-built parameter called Time range picker so we’ll use that. Make sure you tick required to make this mandatory for the Workbook.

Save your new parameter and then click the up arrow to move this section to the top of the page.

Now our query needs a slight adjustment to be able to use the time picker, below you can see I’ve created variables for the time ranges and substituted them into my query in the relevant locations.

let timeRangeStart = {TimeRange:start};
let timeRangeEnd = {TimeRange:end};
Heartbeat
| where TimeGenerated >= timeRangeStart and TimeGenerated <= timeRangeEnd
| summarize heartbeat_per_hour=count() by bin_at(TimeGenerated, 1h, timeRangeStart), Computer
| extend available_per_hour=iff(heartbeat_per_hour>0, true, false)
| summarize total_available_hours=countif(available_per_hour==true) by Computer
| extend total_number_of_buckets=round((timeRangeEnd-timeRangeStart)/1h)
| extend availability_rate=total_available_hours*100/total_number_of_buckets

Lastly we want to add a bit of colour to the report, a nice way to do this is to click on the Column Settings button, select availability rate and configure it to display as a bar. Making the colour palette Red to Green also means that the higher the number the more green the bar becomes allowing servers with poor availability to stand out.

Click save and there you have it a Server Availability Workbook for Azure Monitor. Save this workbook and you can access it from the workbook gallery and also pin it to an existing Azure Dashboard.

Loading

Management Pack Recap – May 2019 Wave

This is a summary of the wave of Management Packs that were released in May 2019. Information and download location in the links provided:

Lenovo Hardware Management Pack v7.6.0.8here

If you know of any other Management Packs that have been released recently that I may have missed leave me a note in the comments and I’ll add them

Loading

Create interactive reports with Azure Monitor workbooks

A new feature in Azure, Workbooks combine text, Analytics queries, Azure Metrics, and parameters into rich interactive reports. 

For those of your familiar with SCOM, think of workbooks as a pre-bundled set of metrics similar to the dashboards you are already familiar with. It offers a simple method to share useful dashboards which can also be copied and exported.

Let’s dive right in.

So how do I find them?

Simply navigate to Monitor in the Azure portal and click on Workbooks, currently in preview at the time of this article.

Whats available currently?

There are several pre-build templates out of the box as well as a GIT available as a repository for additional templates.

VM Metrics Example

Below are several sample outputs of the various workbooks, not only do they look good but they also contain rich useful information on every object in your subscription that is metric enabled.

Loading

Management Pack Recap – January 2019 Wave

This is a summary of the wave of Management Packs that were released in January 2019. Information and download location in the links provided:

SSRS2017+ MP now with Power BI Reporting v7.0.12.0here

Sharepoint 2019 MP v16.0.11308.30000here

If you know of any other Management Packs that have been released recently that I may have missed leave me a note in the comments and I’ll add them

Loading

SCOM: Updated Windows Server 2016 and 1709+ DNS Monitoring MP v10.0.9.2

A new version of the Windows server 2016 and DNS 1706+ Mp is available get it here

Fixed in this version

• Fixed bug: Problem with DNS Zones Discovery for large number of zones.
• Fixed bug: Problem with stub zones discovery.
• Fixed bug: False alerts for “DNS unused Zone Detected”.
• Introduced support for Windows Server 1709+ operating system.
• Rebranded the display strings and knowledge base articles according to the supported
versions of the operating systems: Microsoft Windows Server 2016 and 1709+.

Loading

Management Pack Recap – December 2018 Wave

This is a summary of the wave of Management Packs that were released in December 2018. Information and download location in the links provided:

Lenovo Hardware Management Pack v7.5.0.6here
File Services Management Pack for Windows Server 2016 and 1709+here
Windows Server DHCP 2012 Management Pack v6.0.7309.0  – here
Cluster Services MPhere
Skype for Business Server 2019here

If you know of any other Management Packs that have been released recently that I may have missed leave me a note in the comments and I’ll add them

Loading

SCOM: New File Services Management Pack for Windows Server 2016 and 1709+

A new management pack has been released for Windows Server 2016 and later File Services they are available for download the the following locations

Server 2016 and 1709+here

Server 2012here

Features

Includes new and updated monitoring for File Services, iSCI, DFS and DFS replication

File Services

  • DeDuplication – Stay current
  • FSRM
  • Support for clustered namespaces
  • Support for clustered replication group members
  • Agentless monitoring
  • More detailed product knowledge
  • Support for clustered replication group members
  • Agentless monitoring
  • iSCSI – iSCSI Target is built inbox first time in Server 2016. This is the first version integrated with File Server.
  • NFS – Stay current.
  • SMB – New

DFS Namespaces

Documentation updated to reflect Server 1709+

DFS Replication

New Support for Server 1709+

Loading

Management Pack Recap – October 2018 Wave

This is a summary of the wave of Management Packs that were released in October 2018. Information and download location in the links provided:

Active Directory Domain Services MP v10.0.2.2here
Azure Management Pack v1.6.0.0here

If you know of any other Management Packs that have been released recently that I may have missed leave me a note in the comments and I’ll add them

Loading