Definitely not something you want to see on your second day back at work:
The report server cannot decrypt the symmetric key used to access sensitive or encrypted data in a report server database. You must either restore a backup key or delete all encrypted content.
Luckily my customer had a recent backup of the SSRS key and it was a simple matter to restore the key and restore SCOM reporting functionality.
You may be asking “How do I backup my SSRS encryption key?” no worries it is a simple procedure, I recommend making this process part of a monthly set of tasks.
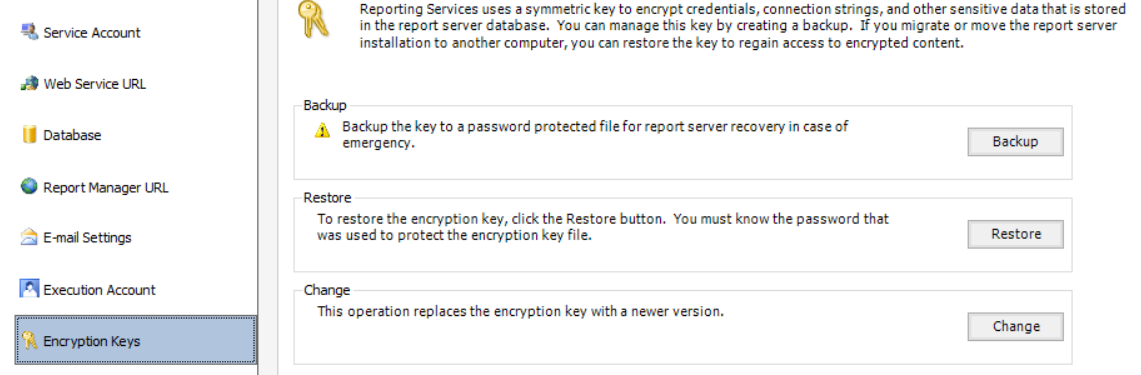
First open your SQL Reporting Services Configuration Manager
Then navigate to Encryption Keys on the left hand side
Then click Backup, you will be promoted for a file name and a password
Restoring the key is similar you just select Restore from the same page and locate the key file and provide the password.
This posting is a follow on in my SCOM basics series.
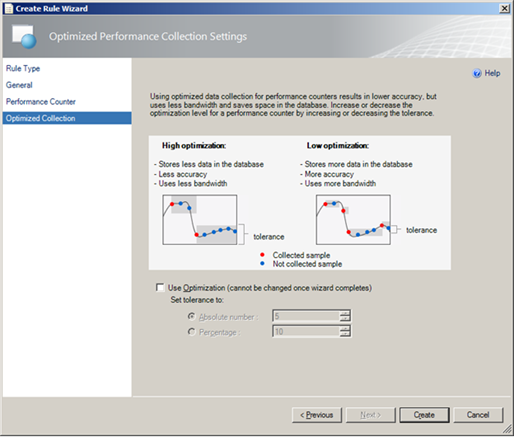
Lets start with what is Optimized Collection?
Optimization for a collection rule only collects a value if it differs from the previous sample by a specified tolerance. This is used to reduce network traffic and the amount of data stored in the Operations Manager database.
How does this affect me?
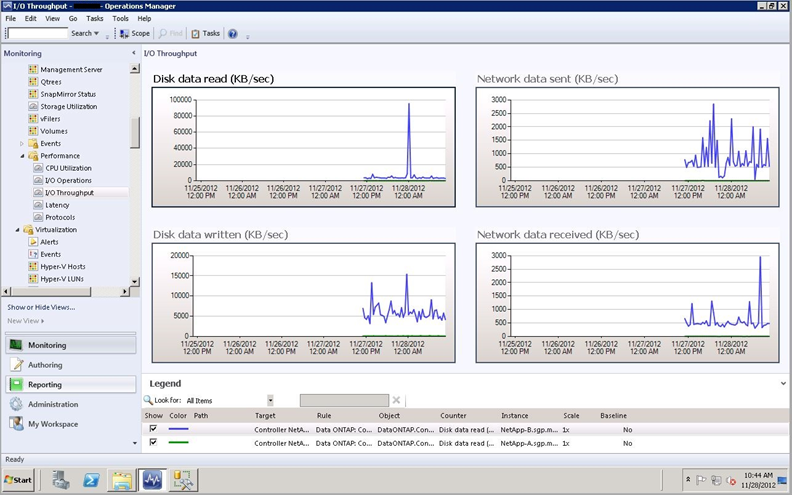
When viewing performance data you need to bear in mind that if the collection rule has optimization enabled then you may see gaps in your graphs if the value has not changed significantly for some time. The below image is an example of how this might look:
Note: Optimization should be used for performance counters that are expected to only change gradually. For counters that are expected to vary significantly from one value to the next, optimized collection should be disabled.
This posting is a continuation of my basics series, this one deals with Understanding Grooming and Aggregation, two very important concepts which can have great impact on your environment if they are not functioning properly.
First you need to understand the different between these two concepts, at their most basic, Grooming is the method where data older then a specific period, called the retention period, is deleted. Aggregation is the method where raw data, which is collected on short intervals i.e. 5 minutes, are averaged into hourly and daily time intervals used for reporting purposes.
The Operations Database
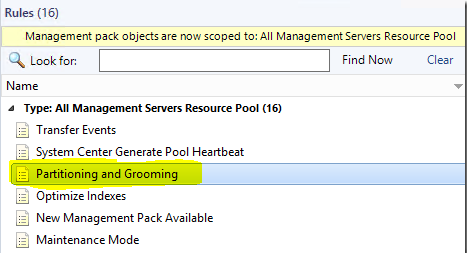
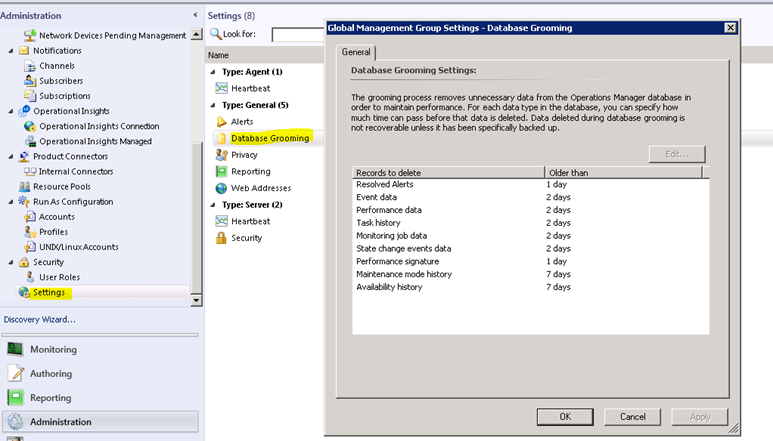
A stored procedure, called p_PartitioningandGrooming is run by a SCOM rule on a once a day schedule. The retention settings for each data type can be set in the console under Administration > Settings > Database Grooming.
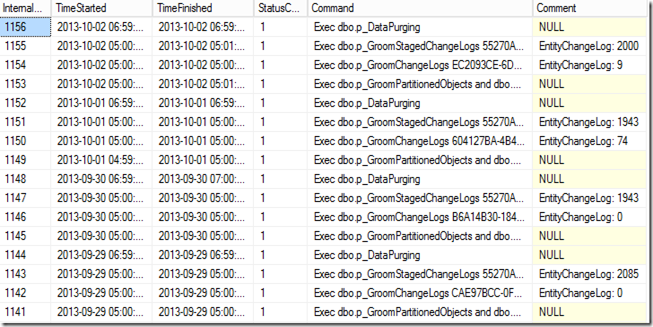
You can see the history of the OpsDB grooming jobs with the following SQL query:
select * from InternalJobHistory order by InternalJobHistoryId desc
A Status of 1 indicates a successful completion.
The Operations Data-warehouse
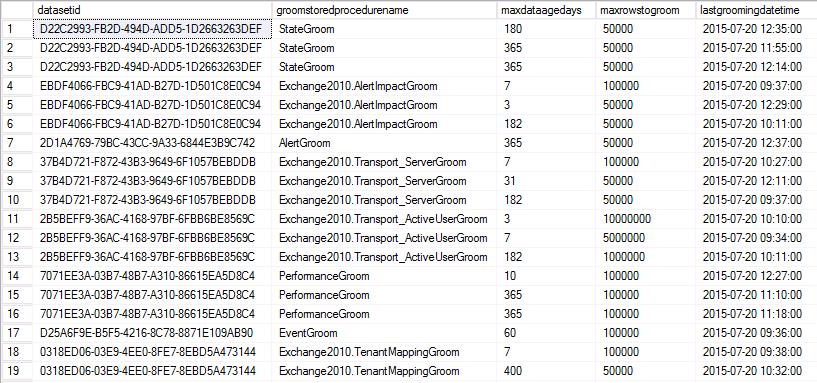
The Data Warehouse is more complex, you cannot change data retention settings from the console, they exist in a table called StandardDatasetAggregation, which contains the grooming and aggregation retention periods, intervals and other related data.
Data in the DW database moves through several tables as part of the aggregations process as the data is collected it is written to a Raw Data table, from there is will move to a Staging table where it will be aggregated and then moved to a relevant aggregated data table (Hourly / Daily) where it will be available to the reporting services.
Then once the data in these tables is older then the data retention period it will be groomed out of the database.
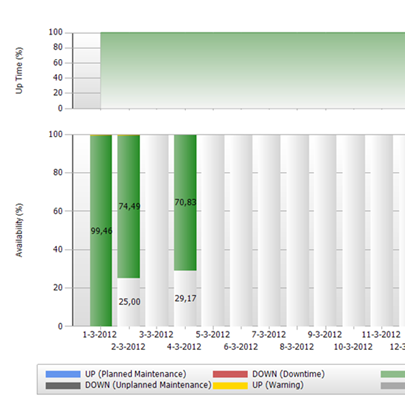
So why is it important for aggregation to work?
Reports use the hourly and daily data in order to generate, this means that if your aggregations are not working or slow there will be gaps in your reporting. Example below:
And there you have it. the basics behind aggregation and grooming, I hope this has been informative.
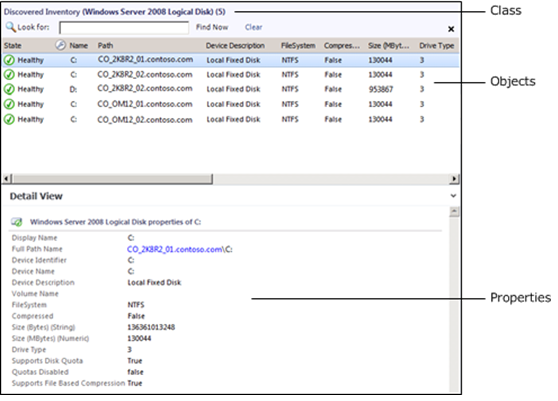
This posting will be part of my SCOM basics series and covers the key concepts of Objects and Classes.
Objects
An object is the basic unit of management in Operations Manager. An object typically represents something in your computing environment, such as a computer, a logical disk, or a database. It could also represent something more abstract, such as an application, an Active Directory domain, or a DNS zone. An object can also be referred to as an instance of a particular Class.
Classes
A class represents a kind of object, and every object in Operations Manager is considered an instance of a particular class. All instances of a class share a common set of properties. Each object has its own values for these properties which are determined when the object is discovered.
Most management packs define a set of classes that describe the different components that make up the application that is being monitored and the relationships between those classes
Targeting
A target in the Operations console represents all instances of a particular class. For example, a viewlists all of the objects that are instances of the class that is used as the target class for the view, and a monitor is applied to all objects that are instances of the monitor’s target class.
Classes have two further categories. Base Classes and Hosted Classes
Base Classes
Every class in Operations Manager has a base class. A class has all the properties of its base class and could add more. All of the classes from the different management packs installed in your management group can be arranged in a tree with each class positioned under its base class.
When you select a class as a target that is a base class for other classes, the monitor or rule applies to all instances of each of those classes. For example, if you use Windows Operating System as the target for a monitor, then the monitor applies to all instances of Windows Client Operating System and Windows Server Operating System. This is because those two classes use Windows Operating System as their base class.
Hosted Classes
Most classes are hosted by another class. When one class hosts another, the hosting class is called the parent, and the class being hosted is called the child. Instances of the child class cannot exist without a parent.
For example, several classes are hosted by Windows Computer because they are components on a computer. It would not make sense to have a logical disk if there was no computer for the disk to be installed on. Therefore, Logical Disk is hosted by Windows Computer. This means that every instance of Logical Disk must have one instance of Windows Computer as its parent.
Note about Groups
I’ve included groups in this posting because it can be a common mistake to try and use a group as a target for a rule / monitor this can cause that rule / monitor to not function correctly as the class for a group only exists on a management server, the group will not be enumerated into it’s members from the target selection.
A question I’ve often posed regarding SCOM is, “Why do should we be using 3rd party utilities to perform certain functions?” and the one that comes up most frequently is scheduling maintenance mode.
Well it’s finally here and i’m not surprised to see it as the first feature cropping up in the community blogs, as it is exciting, we’re finally getting the ability to create maintenance mode schedules from inside the product.
You can find this feature under the administrators node in the console.
I for one am certainly looking forward to see what other surprises are in the System Center goodie bag, more to follow.
I’ve decided to write a series of articles covering some of the tasks that could be helpful to the newer Operations Manager administrators.
This article will cover how to create a custom service monitor and how to implement an automatic service restart action associated with that service. In this example we will use the Print Spooler service.
Creating a custom service monitor:
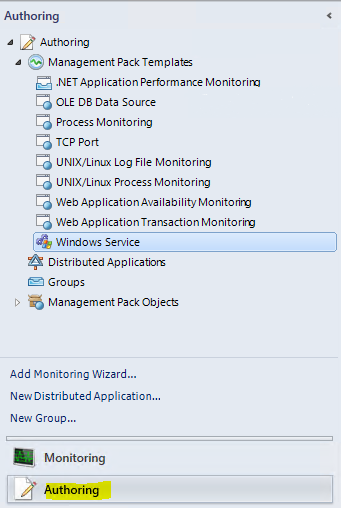
First go to the authoring node of your console, you will see a section called Management Pack Templates, this is where we will create our custom service monitor.
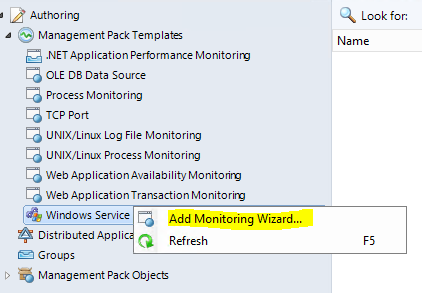
Right click on Windows Service and select Add Monitoring Wizard.
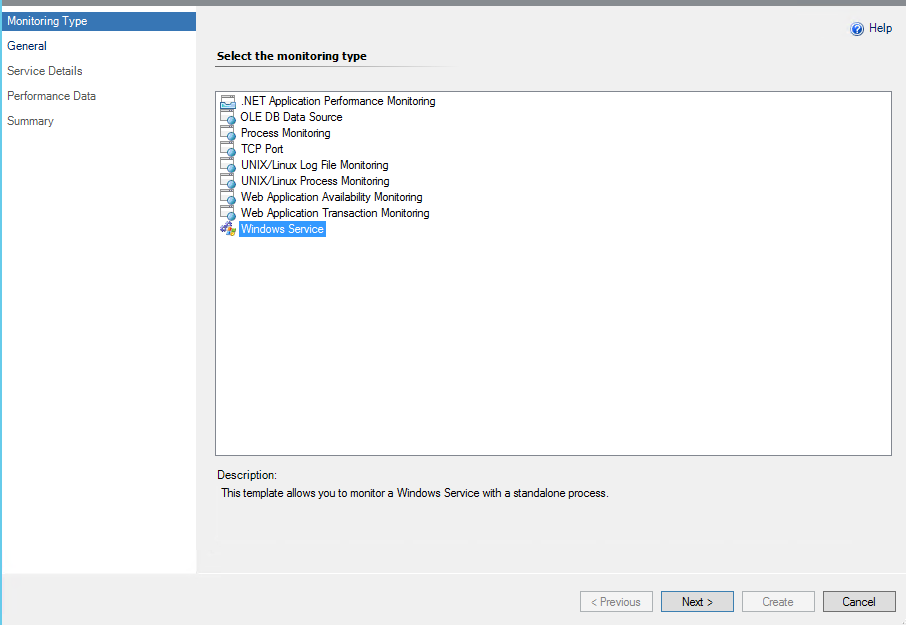
On the first page of the wizard select windows service and click next.
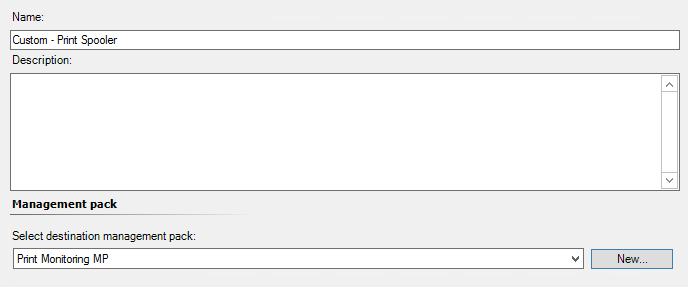
Give your monitor a name and select the management pack that will be used to save it, you can also create a new management pack if required without leaving the wizard by clicking the New button to the right of the drop-down. Click next.
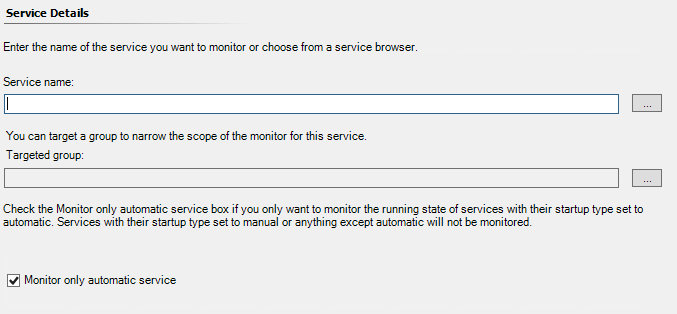
On this screen we need to provide the name of the service to be monitored. Targeting a group will also limit the service discovery to only the grouped service, this prevents unnecessary load on servers that do not have the service. Tick Monitor only automatic services only if the service has automatic start.
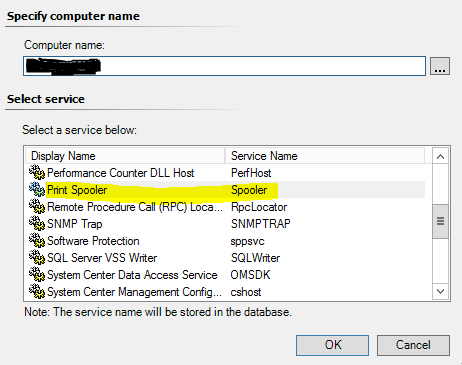
Clicking the “…” button will open the below window allowing you to search for the required service. You can connect to any server using the “…” button next to Computer name.
Select the service and press OK.
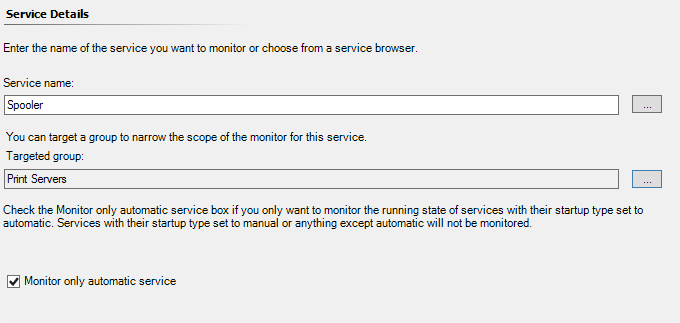
Once the service details are populated click next.
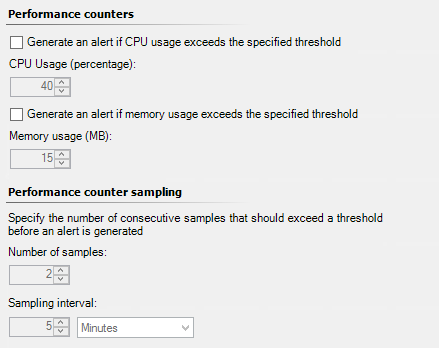
If you need to monitor performance of the service such as memory or CPU utilisation you can configure that here. If it’s not required just click next.
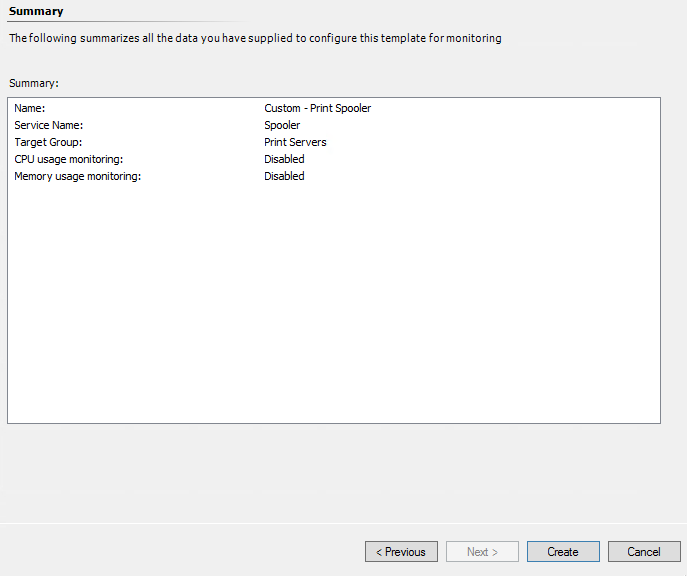
The wizard will now display a final summary for your service monitor. Check everything is correct and click create.
Creating an automatic start service recovery:
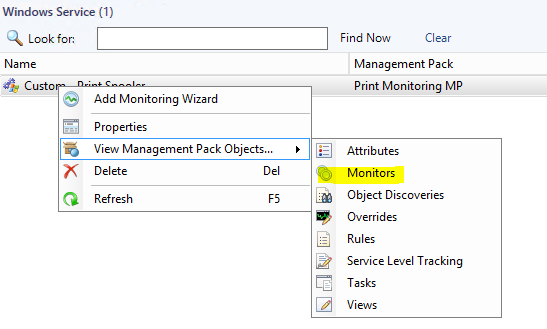
Once your monitor has been created, right click on the service, select View Management Pack Objects and then Monitors.
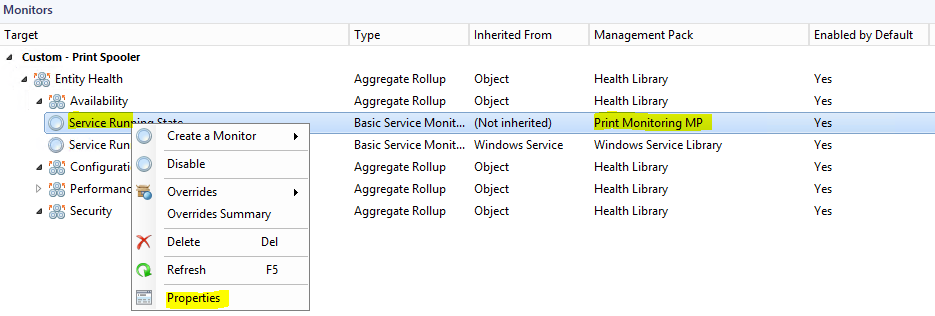
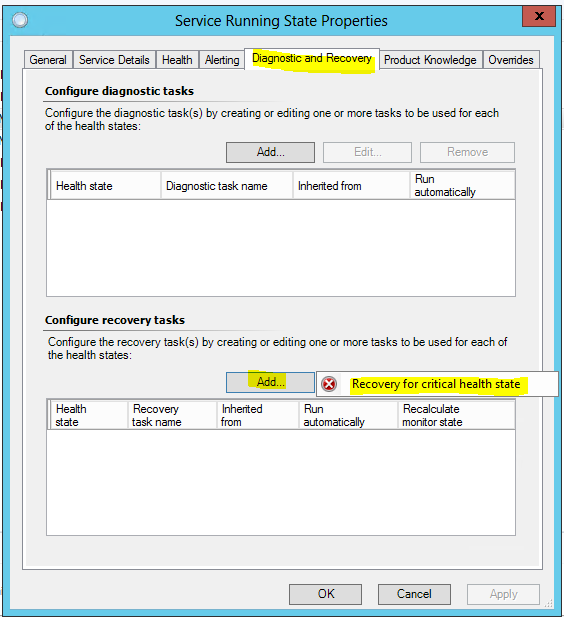
On the monitors page expend the nodes until you find Service Running State, right click on the one that is listed in the same management pack from earlier and choose properties.
In the monitor properties click on the Diagnotic and Recovery tab, click Add under Configure recovery tasks and then select Recovery for critical health state.
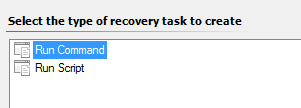
Choose Run Command. Click next.
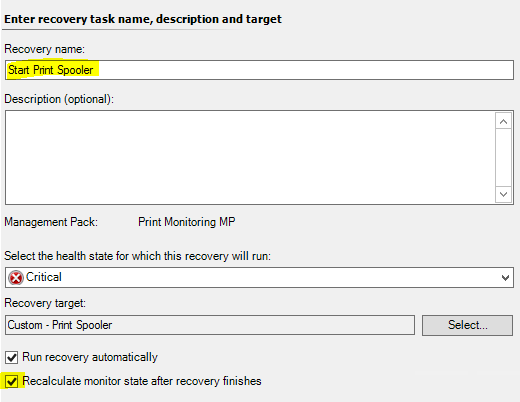
Give the recovery action a name and tick Recalculate monitor state after recovery finishes. Click Next.
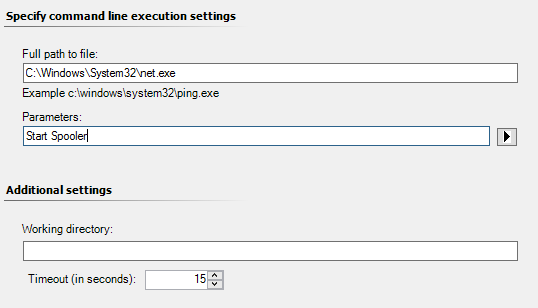
In order to start the service we will use the Net Start command, in full path to file enter the complete path c:\windows\System32\net.exe, next fill in the parameters field, begin with Start followed by the name of your service, in this case Start Spooler.
Note: If the service name contains spaces it is important to enclose the service name in quotes. For example “NetBackup Client Service”
Click create and close the monitor properties.
And there you have it, a custom service monitor with an automatic recovery action.