Recently announced the preview for Azure Managed Grafana is now available. For those who maybe don’t know Grafana is an observability platform which lets you create mixed data dashboards form a variety of sources.
And now you can run it in Azure!
Lets get started
First you need to create a Grafana workspace, in the Azure Portal search for Azure Managed Grafana select it and click +Create. Fill out all the usual suspects, choosing your subscription, resource group, location and workspace name.
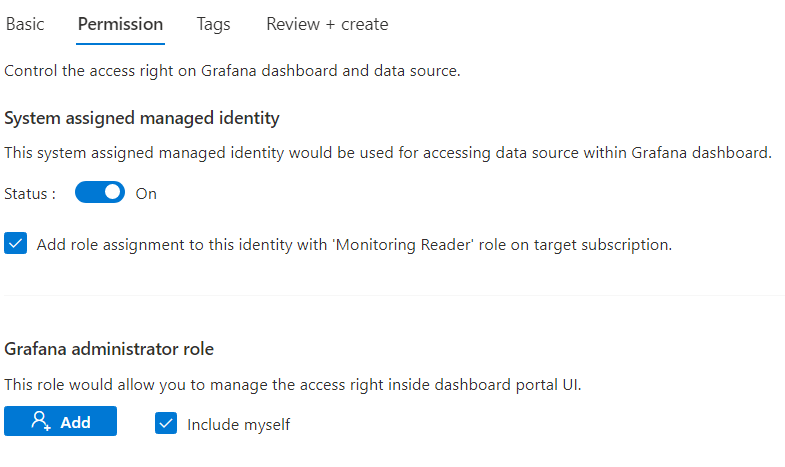
On the following tab create a managed identity as this is the way Grafana will be able to access data from your resources. Then create your workspace.
Next we need access
Grafana needs access to the resources you want to build dashboards for, you can easily do this with Azure RBAC and it can easily be done at the resource group or subscription level as well.
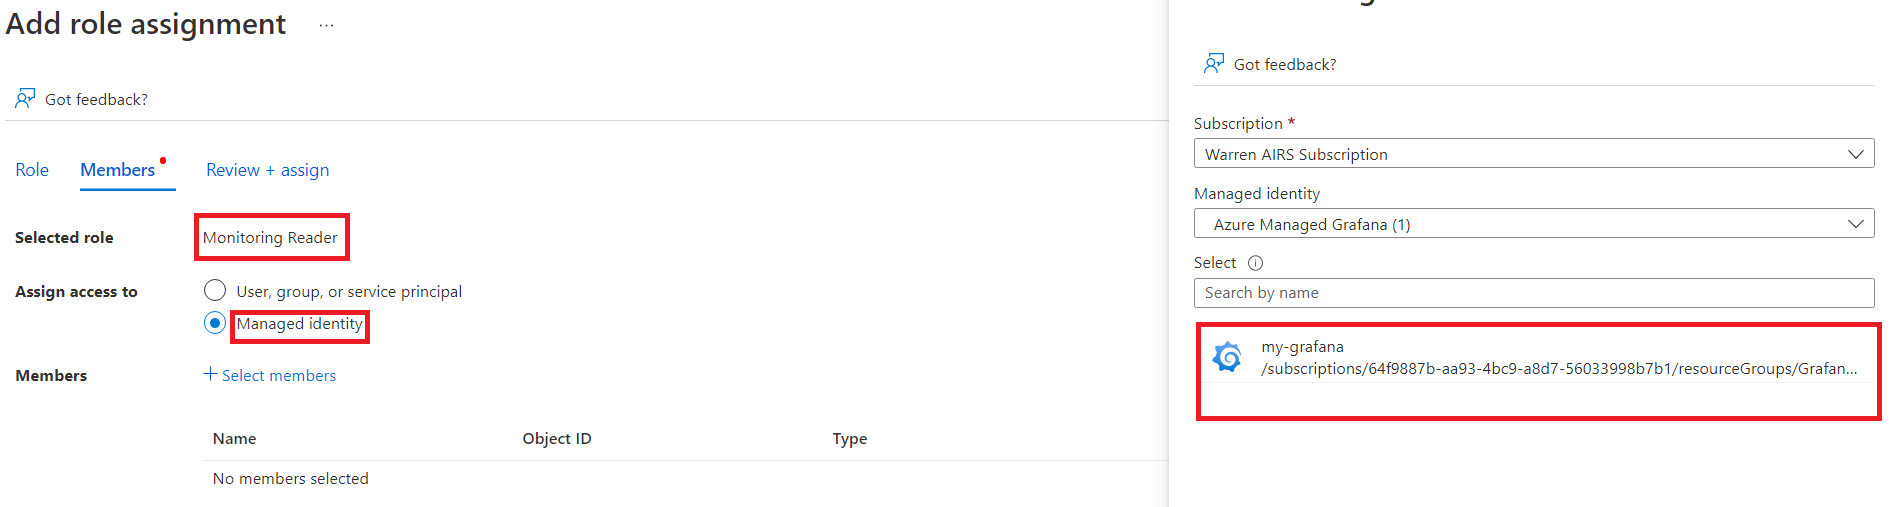
Using Access Control (IAM) give Monitoring reader access to the Managed Identify you created as part of your Grafana workspace
Lets make some dashboards
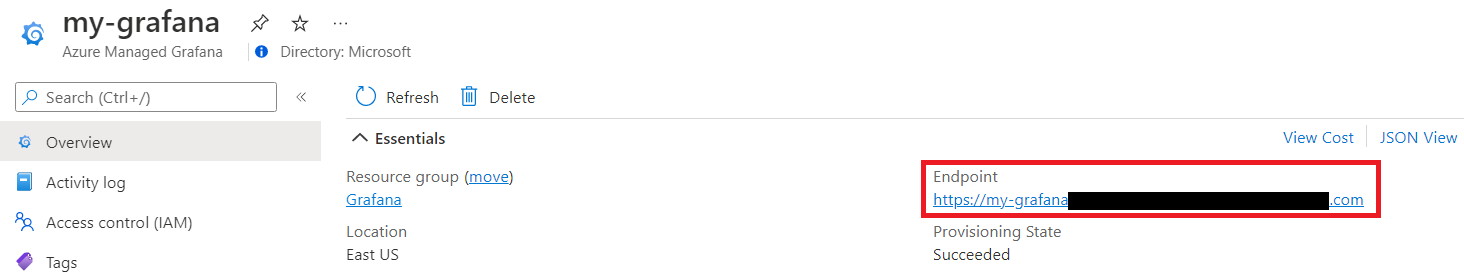
First lets open our Grafana, navigate to the workspace previously created and click on the endpoint address on the Overview blade
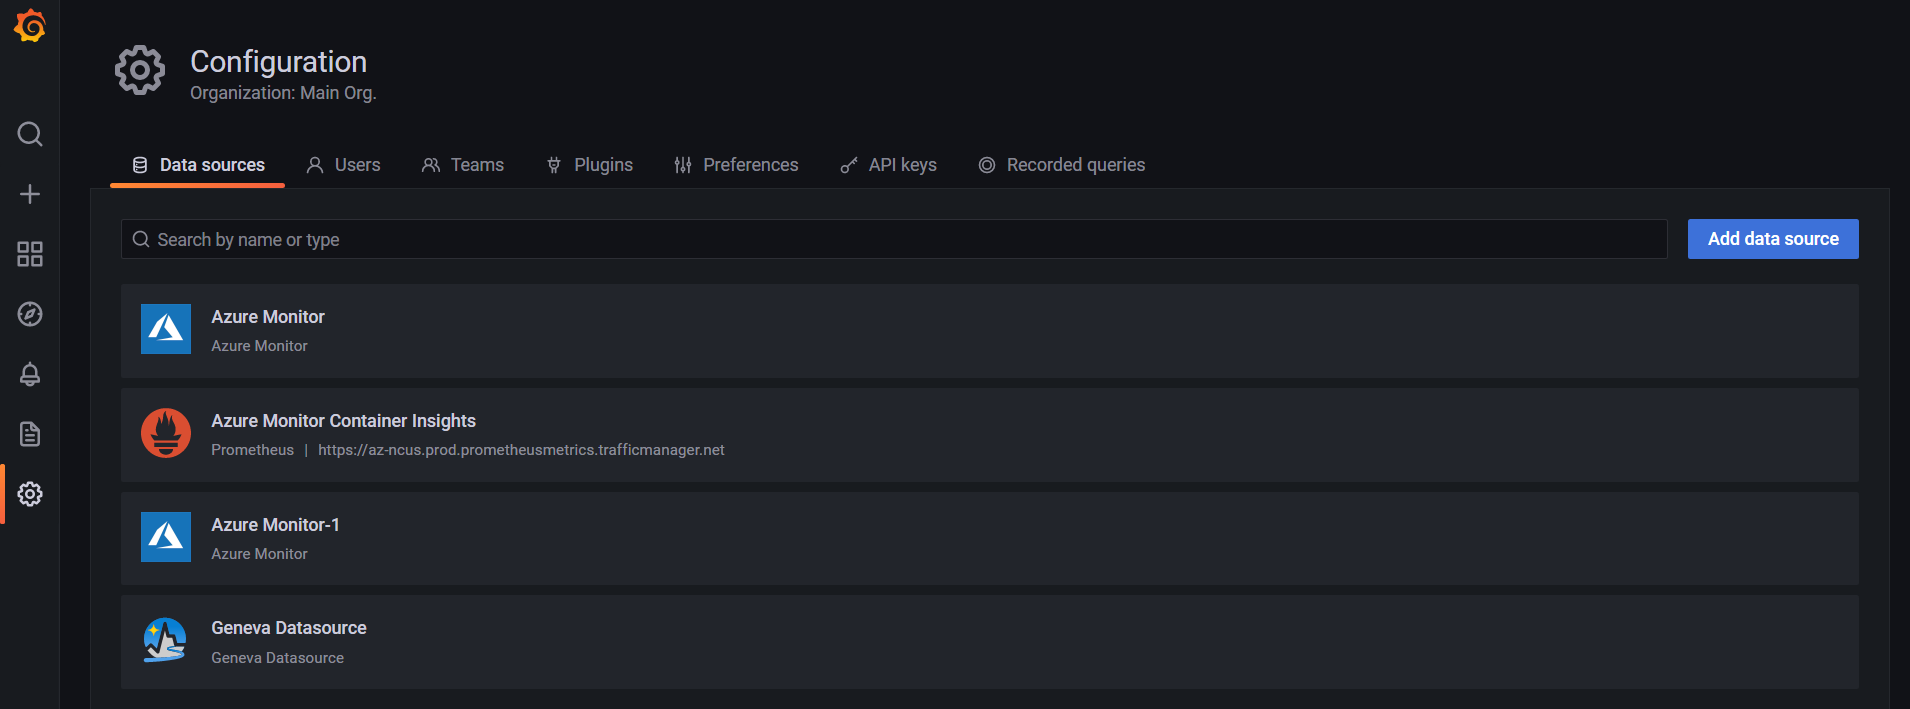
On the landing page there’s a notification to configure a data source. We’ll be using Azure Monitor, simply click add data source and choose Azure Monitor from among all of the available options, we can see here that there are plenty to choose from which is part of the power of Grafana.
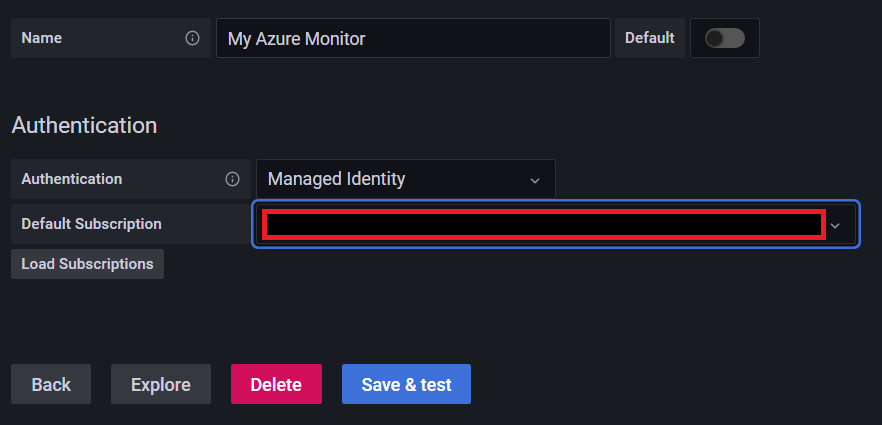
Name your connection, choose managed identify and select the relevant subscription. Then click Save & test
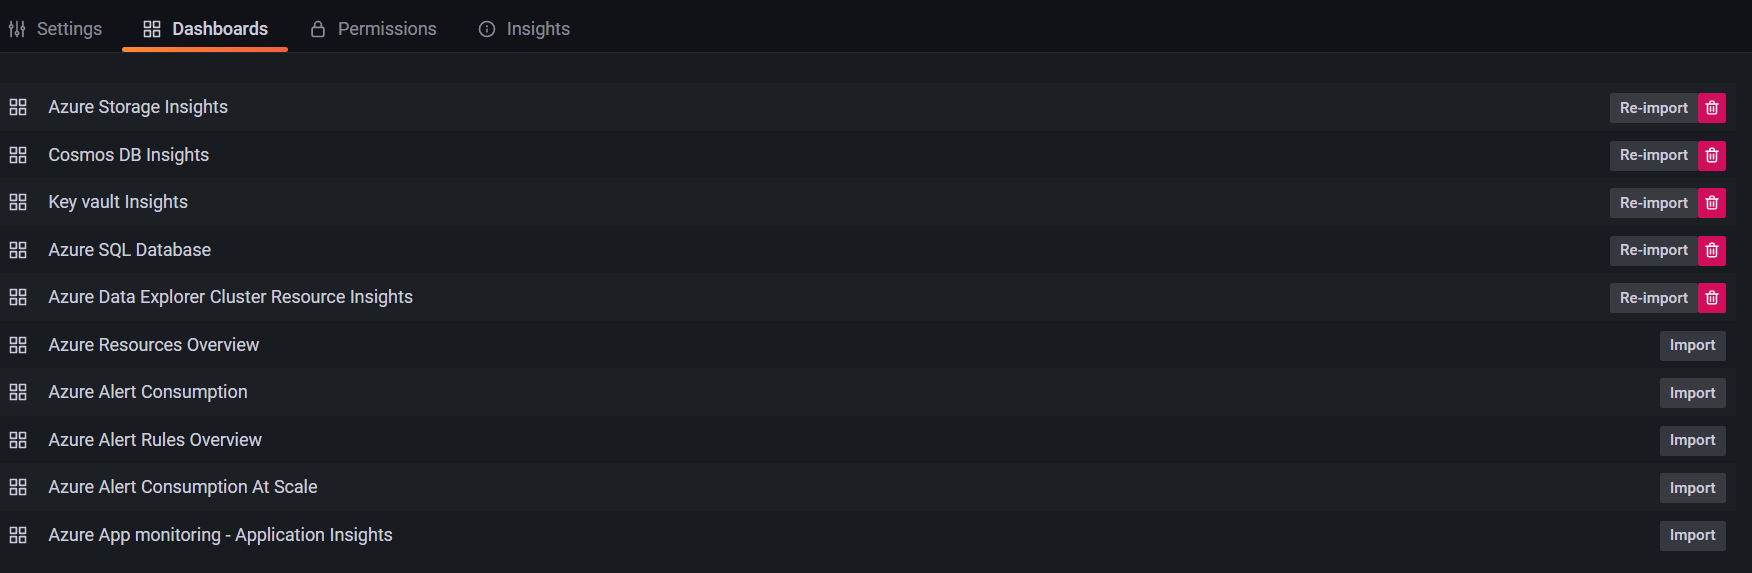
A nice feature is the ability to access pre-built dashboards out of the box, clicking on the Dashboards tab shows us several options which we can import with the click of a button.
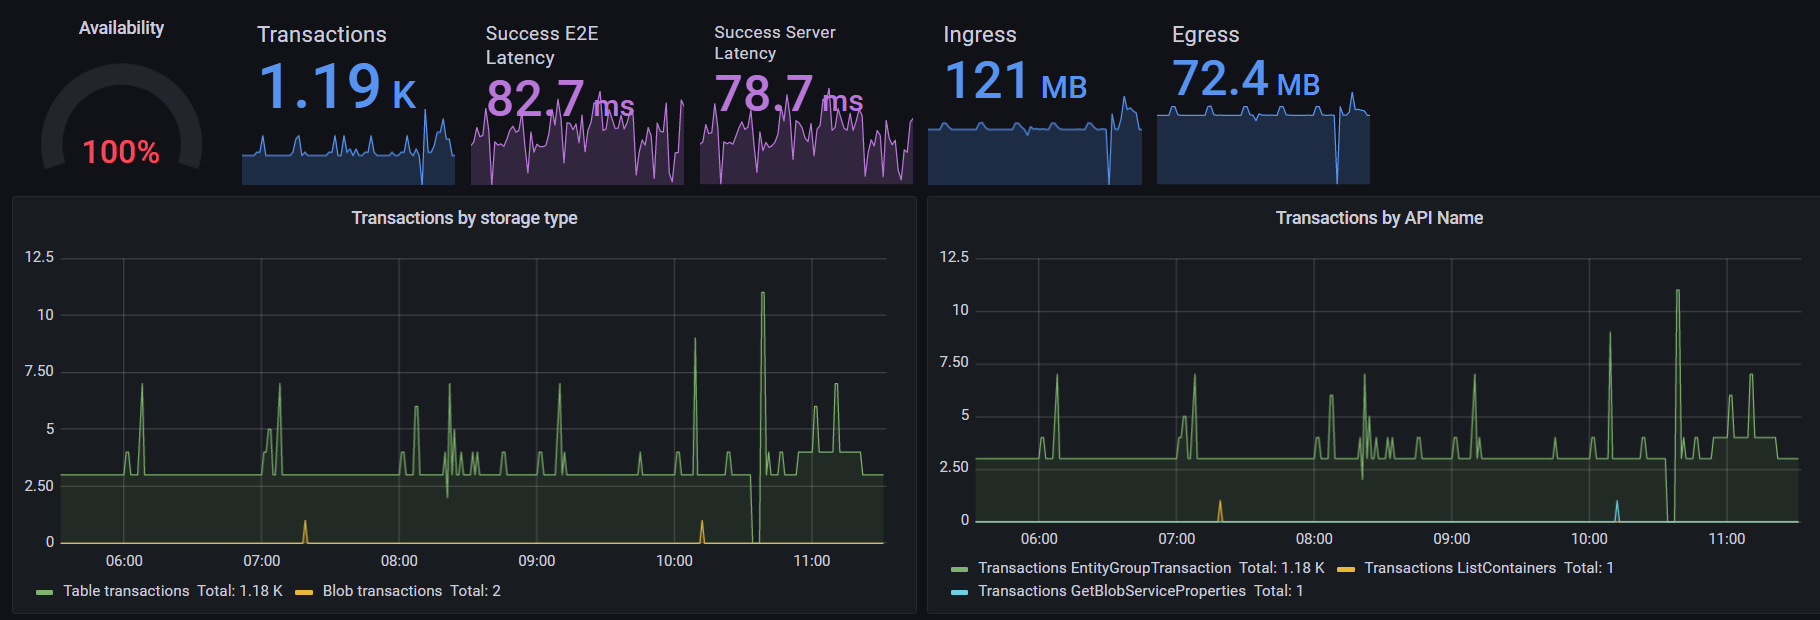
And we’re all set below is an example of the Azure Storage Insights dashboard which I was able to configure from start to finish in less than 5 minutes.
Overall, Azure Managed Grafana is very cool and offers an alternative approach to mixed data dashboards from a variety of sources. Of course, you can also create customized visuals and there are plenty of options to ensure you end up with something meaningful and perfect for your needs. I’m looking forward to seeing this go GA.
Workbooks have a couple of new action types which let you do some very cool things. The one I’m going to focus on now is called ARM actions and this is some amazing stuff , if you thought workbooks were powerful before then watch this space!
Arm Actions
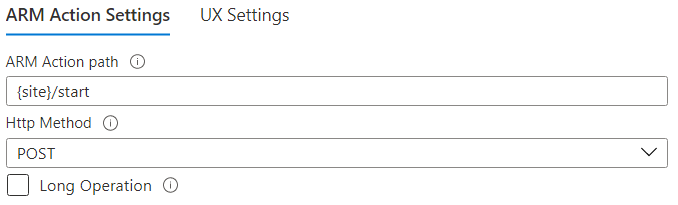
First ARM actions can be used to call various Azure actions against a resource. In the example workbook you can Start and Stop a website which is quite useful as you can do it directly from the workbook without having to navigate to the Resource Blade.
This uses a parameter to fetch the site name and pipes it into an ARM action of Start
Calling a Logic App
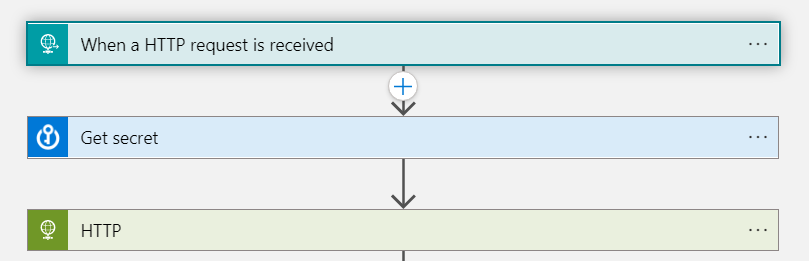
Super cool and very useful. Now lets look at how we can up our game a little bit. Using this same method you can actually call a Logic App, this is slightly more complex as you need to have the ARM Action path to said Logic App which looks like this:
Note the various parameters and you can also parametrize the Logic App name, I have it hardcoded in this example. Also note in this case the trigger type is manual, this because the Logic App trigger is “When an HTTP request is received” and I am sending a JSON payload from the worbook to the Logic App.
You can also specify other triggers for Request, Recurrence and API Connection.
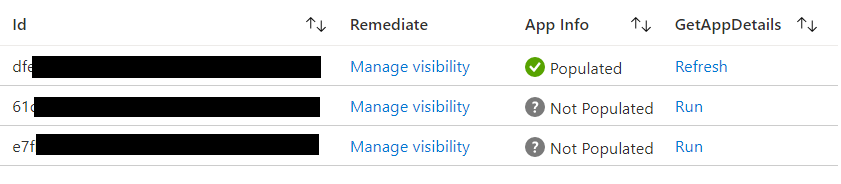
Now what can you do with this? Well as you might imagine the possibilities are endless, in my case I’m calling the Logic App to populate a secondary set of App data into Log Analytics to add more scope to the original workbook.
Once the Logic App has been run the App Info column changes to Populated and the GetAppDetails prompt changes to Refresh, the data is then made visible in a second grid below.
Conclusion
I’m very excited by the world that has opened up with this type of advanced workbook essentially turning them from an awesome visual tool into an awesome manageability tool.
If you ‘ve made use of this functionality I’d love to hear from you.
I was recently afforded a very interesting opportunity to help extend the reporting capability of Microsoft Defender, the end result used a combination of a logic app and a workbook to achieve something that is quite awesome (even if I do say so myself). Huge thanks to Jason Baxter and Hesham SaaD for their part in this.
It is worth noting that while this particular case used Sentinel you can achieve the same with Azure Monitor and a standard logic app, the choice will come down to whether or not the data is security related.
Now while the full details of the solution can be found here. I wanted to take a brief moment to talk about the power of the framework for this solution which can be broken down into key components.
An API – now lots of applications have easily accessible monitoring data, however some don’t and there is often a wealth of information to be found with a web call to an API endpoint.
A logic app – getting data from an API to log analytics may seen complex but using a logic app offers a low code approach which can meet most solutions needs. In the event of scaling it is also possible to use PowerShell and Azure functions to achieve a move robust result.
A Workbook – As some of you may know I am a huge proponent of workbooks, they offer interactivity and flexibility while being easy and quick to create (more on that here), and you can of course also alert on the data once it’s in your Log Analytics workspace or even use PowerBI to further enrich your visuals.
The possibilities are literally endless, in the last week alone I’ve been asked to adapt this method monitor elements of other products such as Microsoft Teams. This a great method to keep in the back pocket and I’d love to hear from anyone who’s using it or something similar.
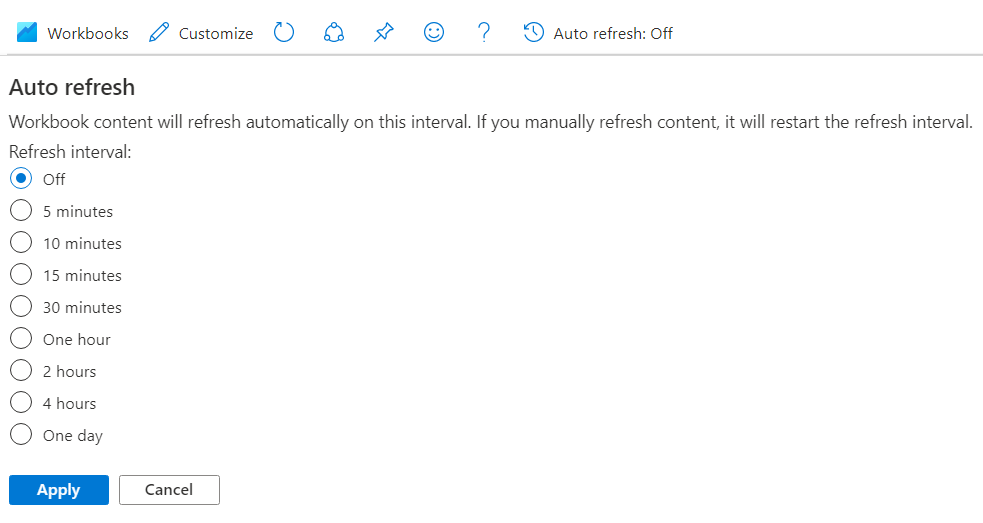
The workbooks community must be well behaved because we’re getting presents all year round.
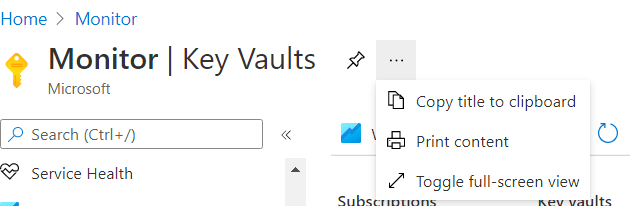
Just released is the ability to set a workbook to auto refresh, simply select the option from the tool bar at the top of the workbook page and choose a refresh interval.
I for one am loving all of the awesome features coming from the workbooks team and looking forward to what’s coming next!
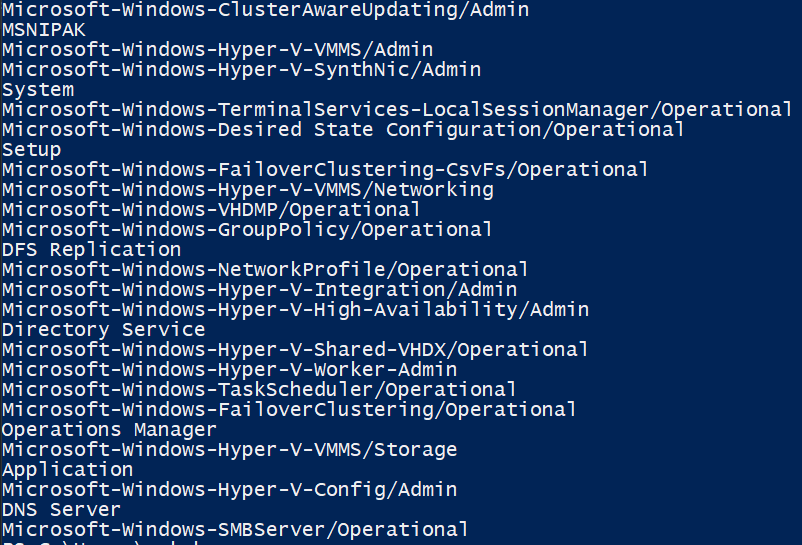
With Event Log collection in Azure Monitor Logs (Log Analytics), if the log name is too long you can’t see the full name in the UI and it can be tricky to check what the log is.
Especially if you don’t have data yet.
Here’s a quick script using Get-AzOperationalInsightsDataSource that will display the event logs you are collecting.
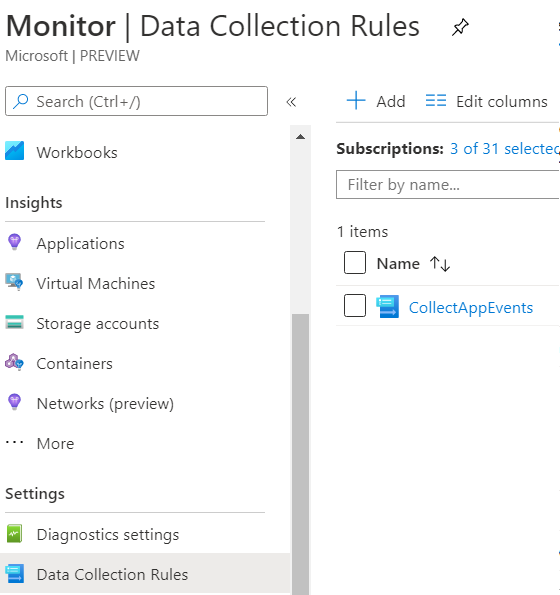
The new Azure Monitor Agent, is available for preview in the Azure Portal, lets have a look at how to configure data collection for this new experience.
If the Azure Monitor blade there are a couple of changes, we’re interested in the new option called Data Collection Rules this is how we’ll tell out new agent what data to collect.
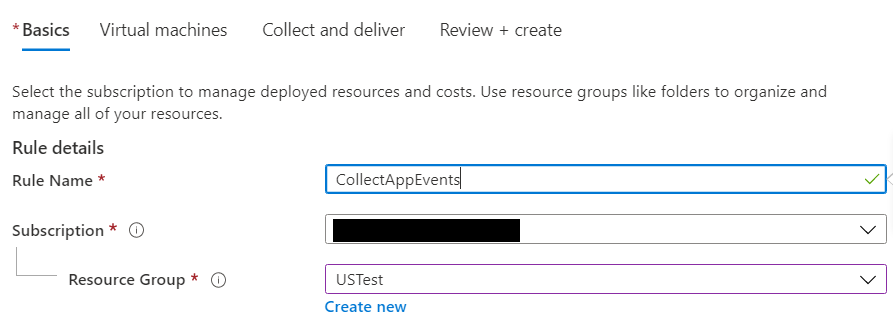
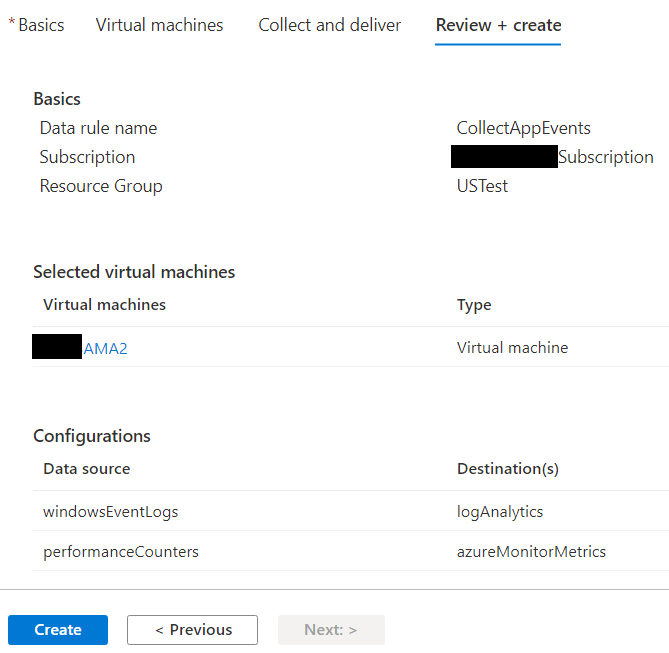
Clicking new we can see there’s a few tabs to configure, under Basics, we need to name our rule, choose a subscription and resource group.
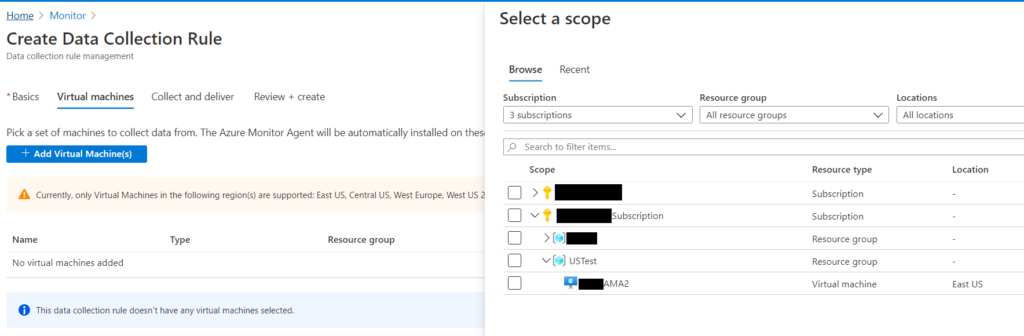
Next we need to choose the Virtual Machines we can to add to the rule, this will also deploy the agent to the VM if necessary. Note that due to the agent being in preview that it is not available in all regions currently.
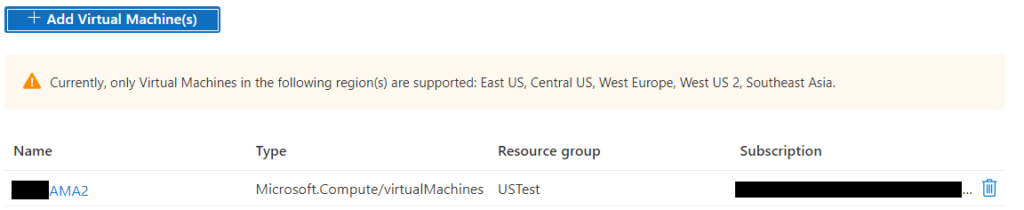
Below the selected machines are all set and ready to go.
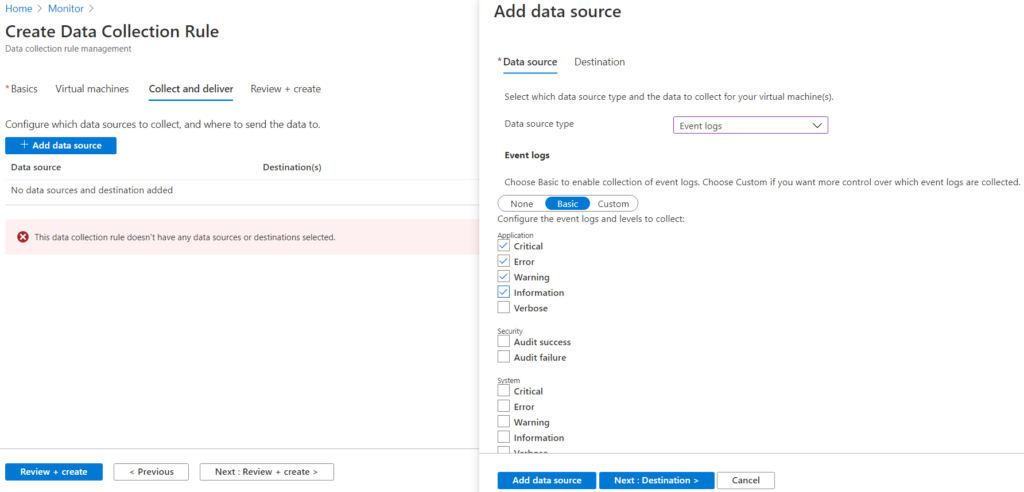
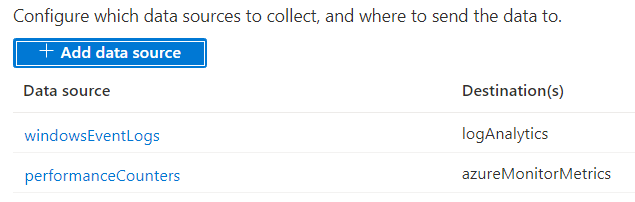
Finally we need to configure what this rule is collecting, you can choose logs or metrics and you can be more granular then before when it comes to log collection with a custom filter.
You can also have log and metrics collections in the same rule.
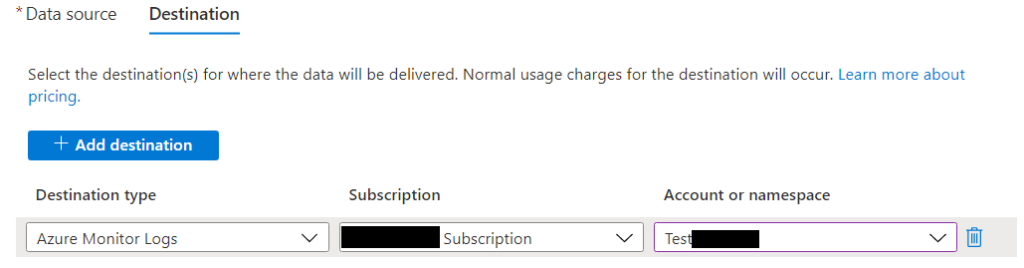
Once everything is configured simply click create, the agent will be deployed if necessary and the collection will start.
It’s quite a common ask, as to how to take the data in an Azure Monitor Logs workspace and create a report that can then be scheduled. Lets take a look at how we can achieve that.
Immediately we are talking about automation when we use the word schedule and Azure has several tools which we can use. The best fit in this case is Logic Apps.
In this example we will create a report showing if any agents haven’t had a successful heartbeat in the past 24 hours.
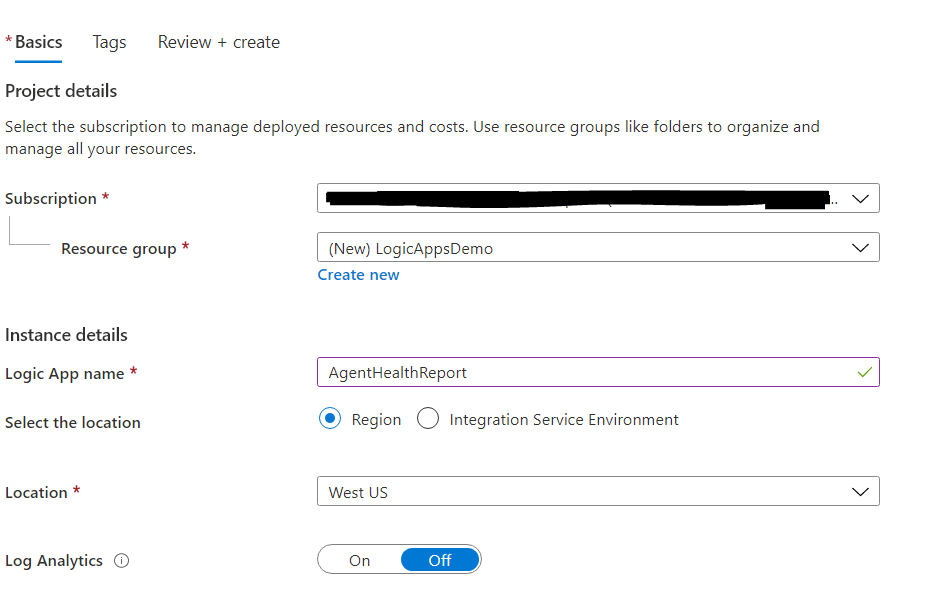
Navigate to the Logic Apps blade in your Azure Portal and click +Add
Populate the fields selecting my subscription and resource group, creating a new RG if necessary. Then I’ll give my logic app a name and choose my Azure region and click Review + Create and then Create
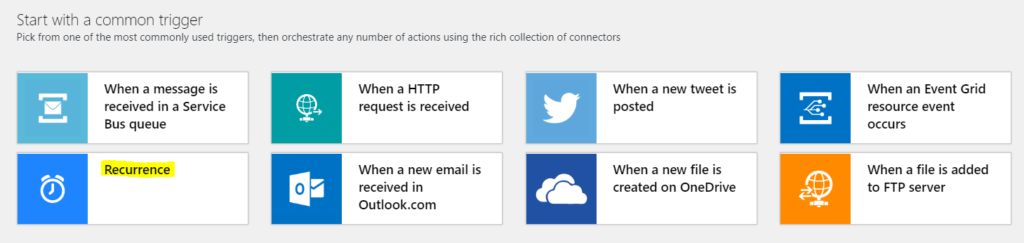
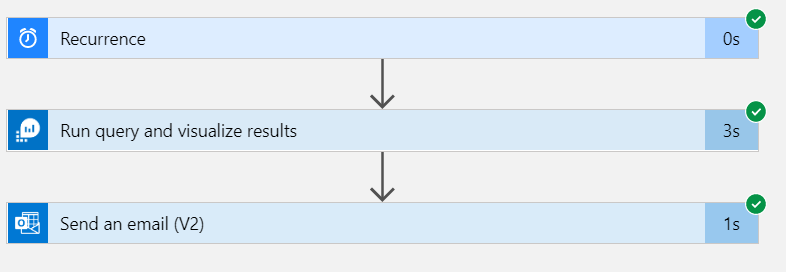
Once the deployment is complete I can navigate to the resource and it automatically opens the Logic Apps Designer. Now every Logic App needs to start with a trigger and because I want to run a schedule I am going to use Recurrence
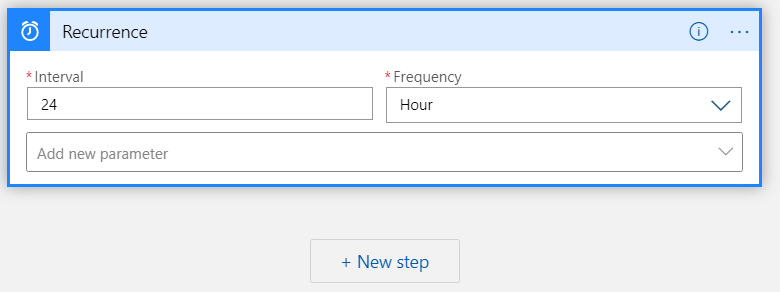
I want this on a daily basis so I’m going to enter 24 Hour as my parameters and then click new step
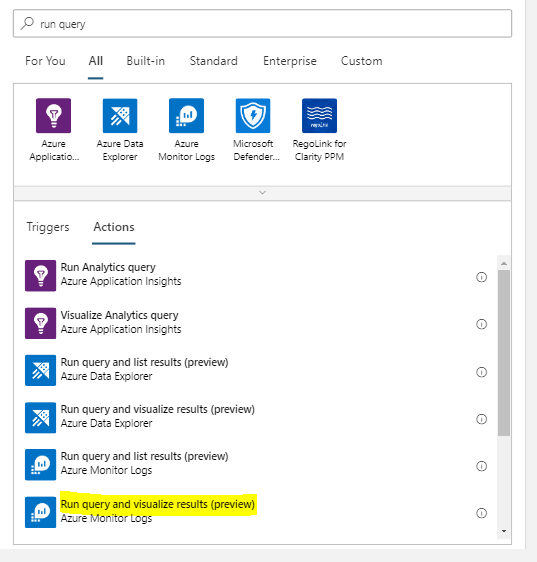
Search for Run Query and Visualize Results as this option will allow a KQL query as a parameter and the results can be manipulated in a variety of ways. Make sure to select the one for Azure Monitor Logs and not for Azure Data Explorer.
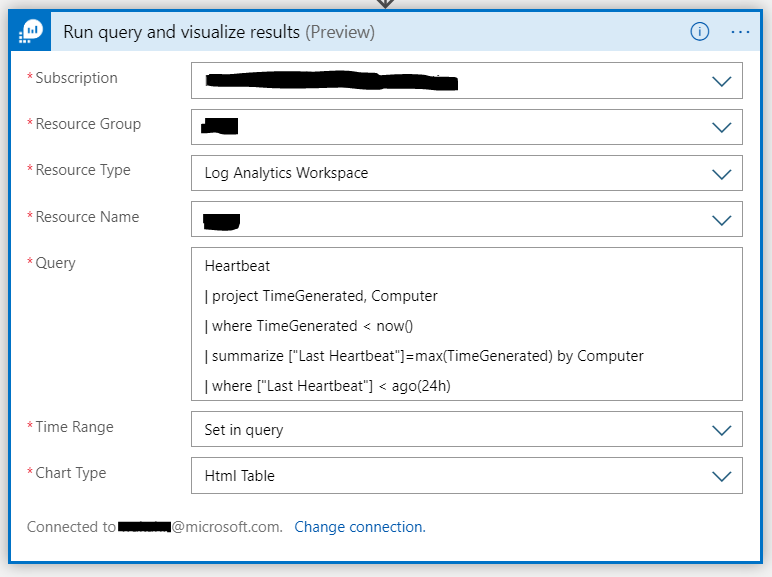
You will need to sign in to create a connection with Azure Monitor Logs. Now populate the fields choosing the subscription, resource group and workspace that contains the data you want to use in your report. Put your query in the relevant section and choose chart type HTML.
Heartbeat
| project TimeGenerated, Computer
| where TimeGenerated < now()
| summarize ["Last Heartbeat"]=max(TimeGenerated) by Computer
| where ["Last Heartbeat"] < ago(24h)
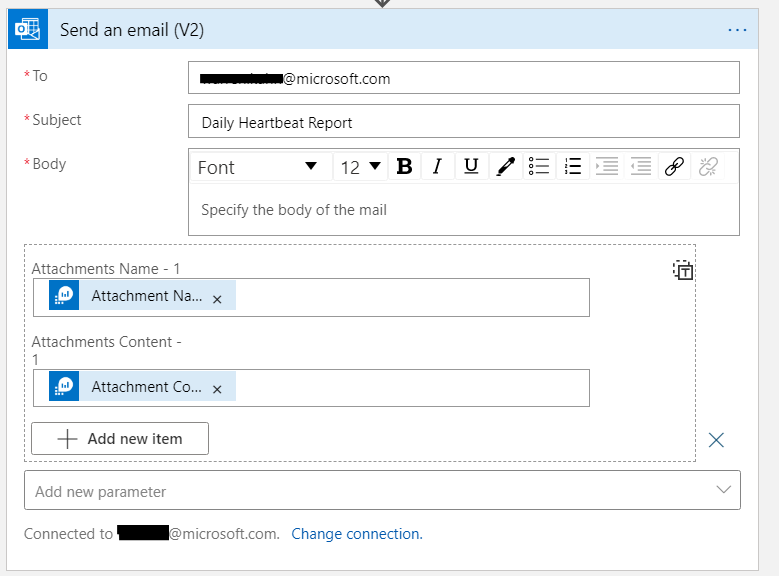
The last thing that needs to be done is connect the logic app to a step to send email, click New Step, search for send an email, I’ll be using Office365 but you can use other providers. Select Send an email v2 and sign in to create the connection.
Populate as below making sure to include the attachments
Click save and we’re all good to go. Now test by clicking Run.
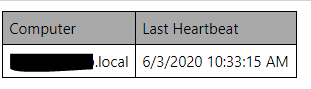
You should receive an email with an attachment and voila opening it will have a nice html table with our query results.
These steps can be easily replicated and amended to be used for any number of handy reports using your Azure Monitor Logs data.
I recently published an article on LinkedIn with my thoughts on monitoring Hybrid cloud with Azure Monitor and SCOM, I am cross posting on my blog for my record but if you prefer you can also read it here https://lnkd.in/d8PvWsH
With the shift of the IT landscape towards public cloud and then toward hybrid there has been some confusion as to which monitoring solutions are the best fit. People with System Center Operations Manager (SCOM) are wondering about the product life-cycle and others are wondering where Azure Monitor comes into the picture.
Hopefully I can shed a little light onto this puzzle.
First lets look at SCOM, well good news, it’s not going anywhere for quite some time. The current iteration 2019 has a commitment of 10 years of support from Microsoft with an Update Rollup release every 6 months. If you have any on-premise real estate then SCOM is still a strong contender to manage those systems with it’s powerful proven track record, extensible custom monitoring and data-center focused features. If you have extended your network into the cloud you can also leverage these features for your data center-like IaaS components such as VMs.
Now for your cloud needs, let’s talk Azure Monitor. You may be thinking “but I’m not using Azure” and that’s ok because have I got more good news for you, Azure Monitor can integrate with VM’s running on other clouds, additionally with Azure Arc you can now make use of Azure services and features on any cloud.
Azure Monitor is a cloud first monitoring tool as such it’s designed to manage and monitor a wide range of cloud components and services leveraging not only the real-time capabilities of Azure Metrics but also the power of Log Analytics both of which feed into a wide variety of insights, visuals and analysis tools. This allows you to have a complete in-depth picture of your cloud real estate from a single location. Azure Monitor is also designed to be configured to monitor only the items you deem most critical which, when done properly results in a lean noise free monitoring experience.
So what should I use to monitor my Hybrid Cloud scenario?
The short answer is: No matter where you are you are on your cloud journey there’s a monitoring scenario that has you covered.
Regardless of whether you are migrating your VMs to an IaaS platform; refactoring your on-premise applications to leverage PaaS/SaaS services or have some applications which reach back into your on-premise environment, you have options and you don’t have to use a single tool either
Lets unpack this a bit.
If you have a large on-premises environment then certainly a data center designed tool such as SCOM will meet your needs and it can also cater for any VMs that you have migrated into the cloud. This will of course give you the on-prem monitoring experience that you are familiar with, which does offer a level of comfort while preparing to move to more cloud focused services.
Similarly if you are nearing the end of your cloud journey then Azure Monitor has got you covered from Billing to Subscriptions and everything in-between. Not only will you be able to proactively handle your tenant and resources through automation but you will also have access to rich interactive reports in the form of workbooks as well as machine learning capabilities.
However if you are between these two scenarios you can use both tools, in fact I’d even encourage it, they work very well together and leverage each others strengths to give a comprehensive single pane of glass across any Hybrid environment.
Adding parameters to a workbook allows you to change values in your queries such as workspace without having to manually edit the query. This makes workbooks much easier to use and widens the potential audience.
Lets look at how to add parameters, some common ones and a little cheat sheet I use to quickly start a new workbook.
Adding Parameters
Parameters can be added into a KQL query by including the parameter name in braces, for example if I have a parameter for Time I can reference it in my KQL query as {Time}
There are currently four different supported parameters:
Text – An editable text box Drop Down – Choose from a defined set of values Time Range Picker – Choose from a predefined set of time range values Resource Picker – Choose from resources selected for the workbook
Example Parameters for our Quick Start Template
Time
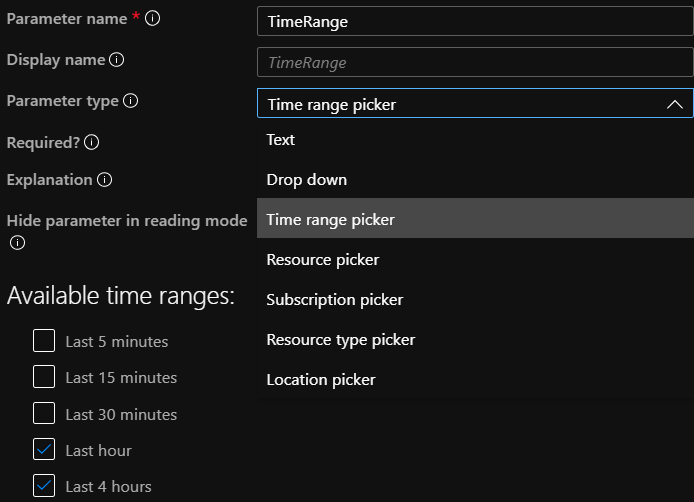
Adding a time parameter is relatively straight forward as it is a pre-defined parameter type, click add parameter and give it a name, select Time range picker from the type field and select the times ranges you want to be available. Then click Save
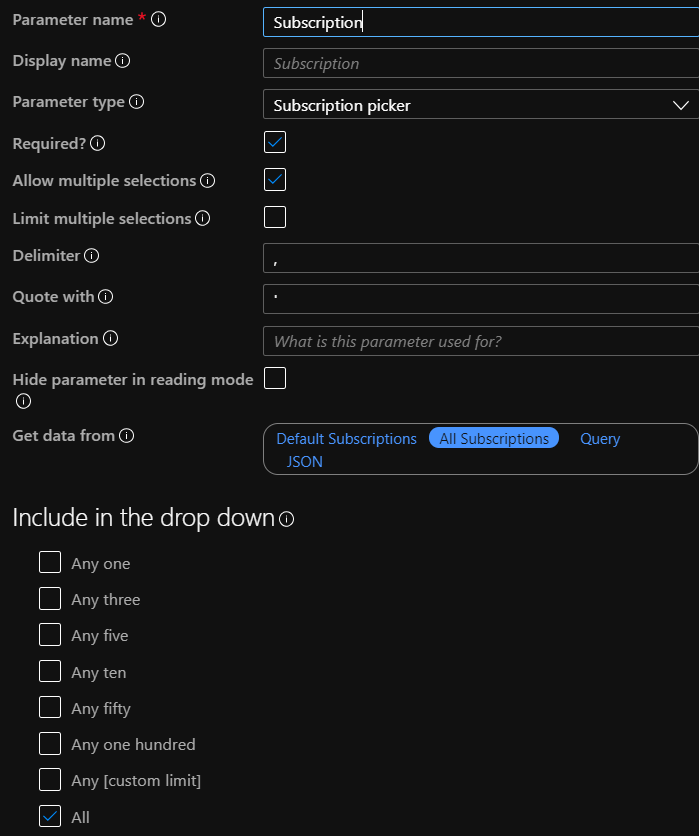
Subscription
Adding a subscription parameter is very useful as it allows your workbook to be able to query across subscriptions easily. After giving the parameter a name, choose Subscription picker from the type. Tick Allow multiple selection and also include the All option below then you can select from Default Subscriptions and All Subscriptions. Then click save.
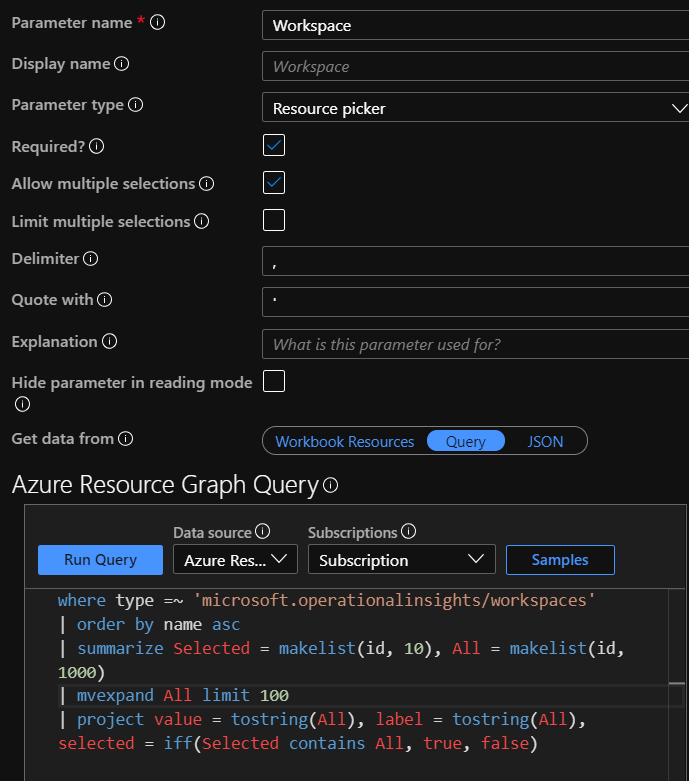
Workspace
Workspace is useful for the same reasons Subscription is, this will allow a workbook to easily query across multiple workspaces from a single location.
This one is a little more complex to configure as it you’ll need to reference the workspaces through a KQL query, there are several ways to do this and i’ll share the one I am currently using.
As before name your parameter, this time choose Resource picker, allow multiple selection and All as options and then select Get data from Query, set your source to Azure Resource Graph and Subscription, the query I use is below:
where type =~ ‘microsoft.operationalinsights/workspaces’ | order by name asc | summarize Selected = makelist(id, 10), All = makelist(id, 1000) | mvexpand All limit 100 | project value = tostring(All), label = tostring(All), selected = iff(Selected contains All, true, false)
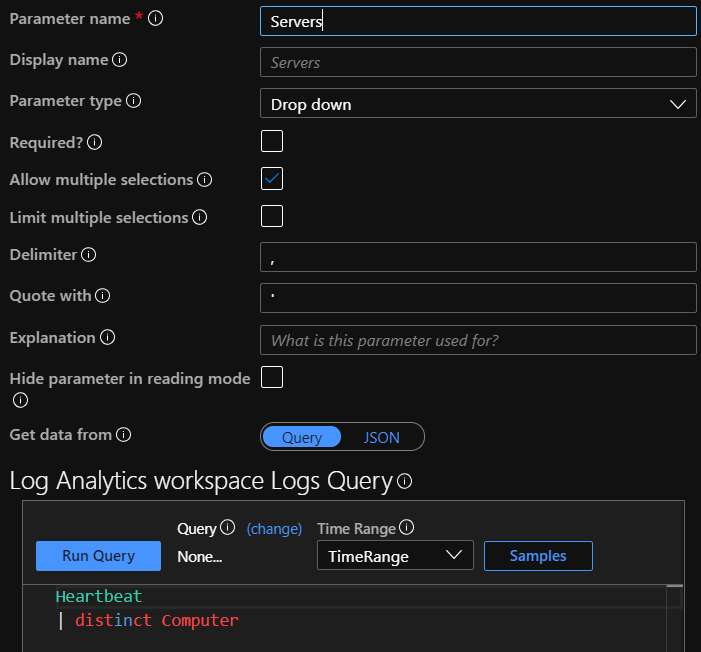
Servers
Not all Workbooks will require Servers but I use it often enough that I include in my Quick Start Template. This time choose Drop down, as before allow Multiple selection and All. We are going to populate our list from a query and a simple way to get a list of Servers is:
Heartbeat | distinct Computer
Once you have saved this workbook with your populated parameters it is now a simple matter to reuse this every time we want to create a new workbook with parameters. All you need to do is edit this one and Save As to start a fresh workbook with pre-done parameters.
Json Template
Below is the template to create your own easy quick start workbook, just create a blank one and paste the json code into the Advanced Editor in the Gallery Template section and click apply.