Author Archives: Warren Kahn

Kusto Detective Agency Season 2 is here!

Welcome back detectives, to a new exciting season of Kusto Detective Agency, this time around there are 10 cases to solve and some new tools to help you sharpen those KQL skills!

What is it?

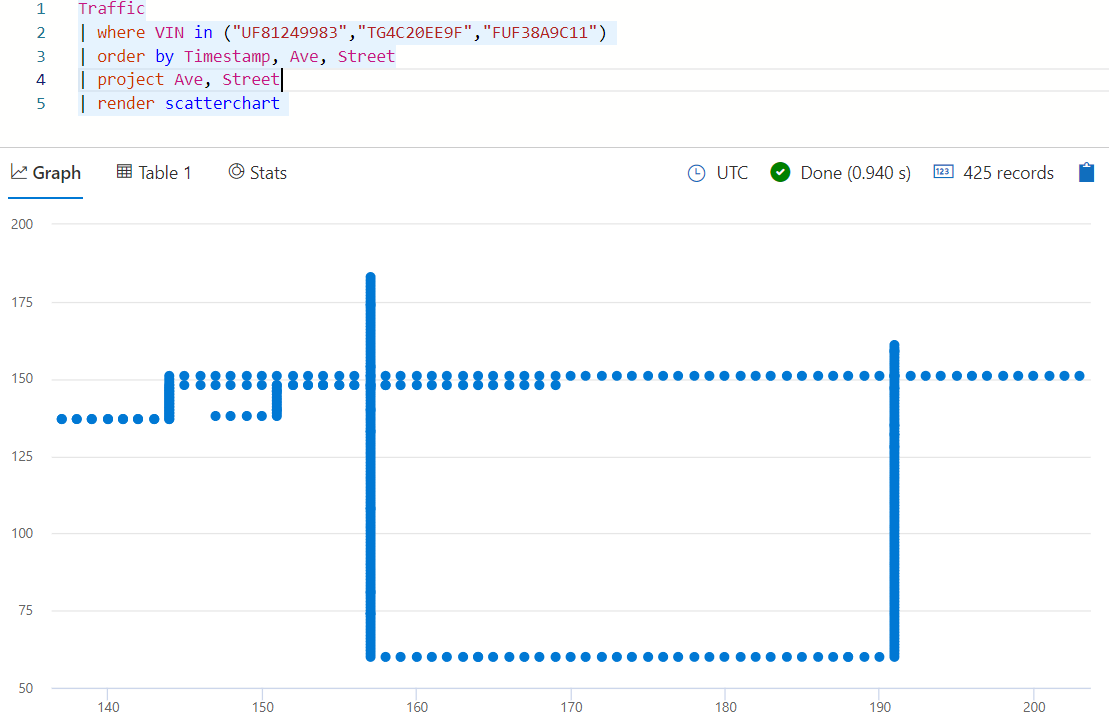
The Kusto Detective Agency is a set of challenges that is designed to help you learn the Kusto Query Language (KQL), which is the language used by several Azure services including Azure Monitor, Sentinel, M365 Defender and Azure Data Explorer (ADX) to name a few. The challenges are gamified and interactive and consist different exciting cases across two seasons.

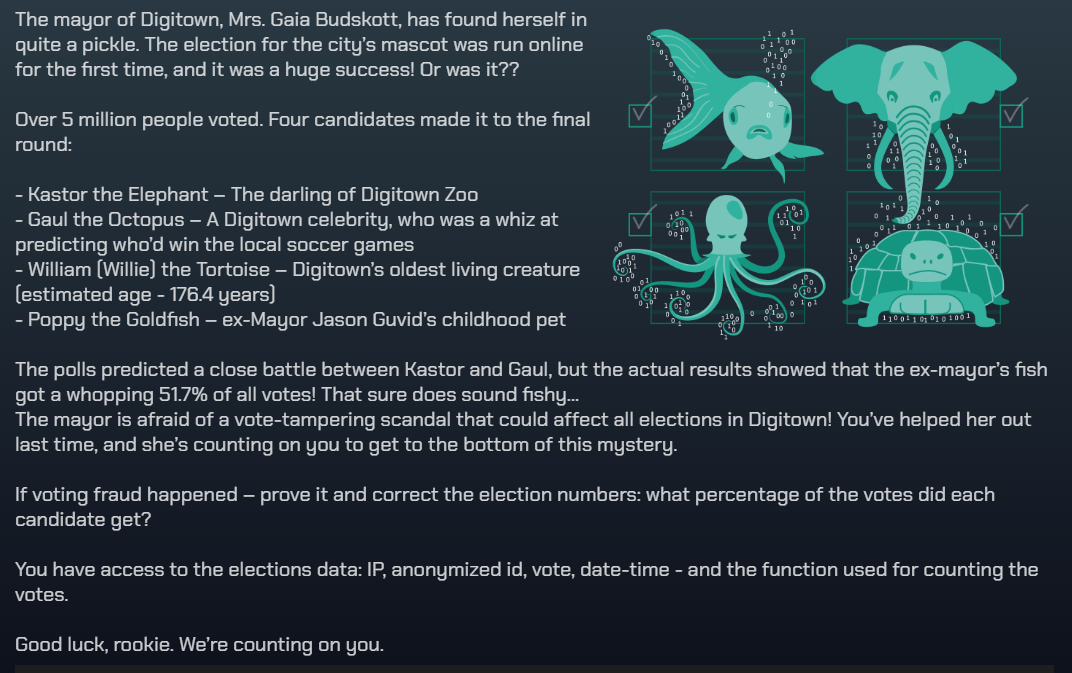
Each case has a different scenario that you need to solve using KQL queries, where you can earn badges, and they get progressively more difficult as you help the citizens of Digitown.

Season 1 is still available, and I talk about my experience with those challenges here.

Where can I get started?

It’s easy to get started just creating your free ADX cluster and report for duty at the detective agency!

Access the challenges here – https://detective.kusto.io/
Create your free ADX cluster here – https://aka.ms/kustofree

What’s new?

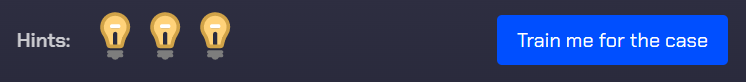
Hints return from season 1 but the new and exciting feature is a set of training that you can complete to prepare you for each case. This highlights specific commands and techniques that are relevant to solving the various puzzles. Just click “Train me for the case to get started”.

My thoughts

KQL is very valuable considering all of the products that make use of the language and being able to write a basic query does make working with those products much easier. Learning in this gamified way also makes the process more interesting and if the cases from season 2 are anything like season 1 we’re in for a lot of fun. I will be documenting my experience with season 2 and would highly recommend the Kusto detective Agency for anyone who could benefit from KQL skills.

Loading

Supercharge your Career Development Plan with a little help from AI!

Career development planning can be challenging, time consuming and even overwhelming. I’ve looked at using popular AI tools such as ChatGPT to see if this process can be easier and let me tell you, it certainly can be.

Here are several AI prompts and instructions that I’ve used to great effect and wanted to share so that others can benefit from them too.

CareerGPT

First CareerGPT which now comes in two flavors both of which will help you create a quality career development plan quickly and easily, which you can then use in future planning and career discussions.

The guided experience (v1) – Step through an easy to uses guided approach to creating a development plan with explanations and tips to help you get the best outcome.

The prompts, instructions and original article can be found here – https://aka.ms/careergpt

The advanced experience (v2) – Join your virtual career panel that will ask you questions and make recommendations to help you build your career plan. This is a more “human” experience and is focused on the output rather than the guided step-by-step approach.

Learn more about the advanced experience here
The prompts and instructions can be found here – https://aka.ms/CareerGPTv2
Check out my colleague Werner building his career plan, in under 10 minutes, using the guided experience over on Youtube

Role advisor

Sometimes all we need to get started are some ideas for future roles, this conversation can unfortunatly be a little bit like asking a child “What do you want to be when you grow up?” If all we’ve even been exposed to are doctors, teachers and tiktokers then it’s hard to think outside that box.

Enter Role Advisor here to help you find career options suited to your skillset, read more about it here

The prompts and instructions can be found here – https://aka.ms/RoleAdvisor

Feedback

Hopefully this has been useful, it would be awesome if you could take 1 minute to fill out a short survey to let me know how this worked for you, so that I can make this better in the future!

Find the survey here – aka.ms/careergptfeedback

Enjoy and happy career planning!

Loading

SCOM 2019: Update Rollup 5 is out!

UR5 for SCOM 2019 is available get it here!

A reasonable update with some quality-of-life fixes and enhancements, the most notable addition is the ability to discover SCOM MI instances in Azure which supports the hybrid approach to giving a single pane of glass across your on-prem and cloud IaaS estate.

Improvements

  • Discover Azure Monitor SCOM Managed Instance (preview) from SCOM console.

Issues that are fixed

Operations Manager 2019 Update Rollup 5 includes fixes for the following issues:

  • Fixed an issue where editing an existing Maintenance Mode schedule does not change the Reason and/or Comment.
  • Fixed an issue where when setting Maintenance Mode via PowerShell, the Availability Reports were not reflecting correct information.
  • Fixed the issue in which Member column in group View was introducing delay in group operations.
  • Fixed an issue of users getting HTTP200 error when trying to setup Log Analytics connection.
  • The script (GetOpsMgrDBPercentFreeSpace.vbs) which is part of System Center Core Monitoring MP monitor has been moved from VBS to PowerShell and, now reports Operations DataBase free space correctly.
  • A new registry key (for debugging purposes) to enable Bad.xml file creation is introduced in UR5 which does not exist by default but needs to be created. Registry key details below.
    • [HKLM\SYSTEM\CurrentControlSet\Services\HealthService\Parameters] – XmlDebugEnabled (DWORD) – default 0 and 1 for ENABLED

Security Enhancements

  • Fixed multiple Web Console Security Vulnerabilities.
    • Note: The Web.config files of both HTMLDashboard and MonitoringView web apps will be replaced, so any changes done to settings inside of these will have to be remade.
  • The organization of temporary files used for kerberos based authentication is further enhanced to prevent any misuse.
  • Fixed Data parsing issues in Linux agent that might cause the agent to crash.

Unix/Linux/Network monitoring fixes and changes

  • Fixed an issue where msgAuthenticationParameters needs to have 0 length during engine discovery of SNMPv3 devices. Also
  • Fixed an issue related to SNMP Discovery where we see MonitoringHost.exe crashes.
  • Fixed the issue where user was unable to run Get-SCXAgent and Invoke-SCXDiscovery remotely using Invoke-Command.
  • Fixed Linux agent crash issue caused by variable out of scope issue for _HandleGetClassReq.
  • Fixed an issue that would causes Linux agent to crash when DSC provider is installed.
  • Added supportability on Operations Manager Linux Agent for Rocky Linux 8, Alma Linux 8. systems with OpenSSL 3.0, RHEL 9.0 and Ubuntu 22.

Loading

Monitor better, react faster!

“Perception is the key to reaction; the sharper your perception, the quicker your reaction” – Unknown

This adage holds true in many aspects of life, including cloud monitoring and security. In today’s digital world, cloud infrastructure is the backbone of most organizations, and ensuring the security and availability of these resources is critical. To do this effectively, you need to have a clear view of your cloud infrastructure, and be able to detect and react to threats quickly. This is where perception comes in.

Cloud monitoring is the process of tracking and analyzing the performance, availability, and security of cloud resources. It involves collecting data from various sources and analyzing it to identify trends, anomalies, and potential threats. A key aspect of effective cloud monitoring is having a sharp perception of what’s happening in your cloud environment. This means being able to see and understand the data that’s being generated by your cloud infrastructure, and being able to quickly detect any anomalies or deviations from normal behavior.

One of the biggest challenges with cloud monitoring is the sheer volume of data that’s generated by modern cloud environments. With thousands of resources spread across multiple regions and availability zones, it can be difficult to get a clear view of what’s happening in your cloud environment. This is where cloud monitoring tools such as Azure Monitor and Sentinel come in. These tools are designed to help you collect, analyze, and visualize cloud data in a way that’s easy to understand and act upon.

However, even with the best cloud monitoring tools, perception is still key. You need to be able to interpret the data that’s being generated by these tools and make quick decisions based on that information. This requires not just technical expertise, but also the ability to understand the context and significance of the data that’s being generated.

Cloud security is another area where perception is critical. With cloud environments, security is not just about protecting physical assets; it’s also about protecting data and applications. This means being able to detect and react to threats quickly, before they can cause significant damage. Again, having a sharp perception of what’s happening in your cloud environment is essential for effective security. This also includes tracking and analyzing security events in your cloud infrastructure, such as unauthorized access attempts, data breaches, and malware infections. It requires collecting and analyzing large amounts of security data, and being able to quickly identify and respond to security incidents. This requires not just technical expertise, but also the ability to quickly interpret and understand the significance of security events.

In conclusion, perception is the key to effective cloud monitoring and security. The sharper your perception, the quicker your reaction, and the more effectively you can protect your cloud infrastructure. To achieve this, you need to have the right cloud monitoring tools in place, as well as the expertise to interpret and act on the data that’s being generated. With the right approach, you can ensure the security and availability of your cloud resources and keep your organization safe from cyber threats.

https://www.linkedin.com/pulse/monitor-better-react-faster-warren-kahn

Loading

Azure Monitor Basics: Best practices for configuring Azure Monitor alerts

Azure Monitor is a powerful tool that can help you keep track of the performance and health of your Azure resources. One of its most useful features is the ability to set up alerts that notify you when certain conditions are met. However, in order to make the most of this feature, it’s important to follow some best practices when configuring your alerts.

  1. Be specific with your alerts: When setting up alerts, it’s important to be as specific as possible. This means identifying the exact resource or metric that you want to monitor, as well as the specific condition that should trigger the alert. For example, instead of setting up a general alert for “high CPU usage,” set up an alert specifically for “CPU usage on WebApp1 exceeds 80% for 15 minutes.”
  2. Use alert suppression: In some cases, you may not want to receive alerts for certain conditions. For example, you may want to suppress alerts during maintenance periods or when you know that a particular resource is experiencing high load. Azure Monitor allows you to suppress alerts based on specific conditions, such as time of day or the presence of specific keywords in the alert description. For example, you can suppress alerts during non-business hours by setting the suppression time to outside of your business hours.
  3. Use action groups: Azure Monitor alerts can be configured to take a number of different actions when triggered, such as sending an email, creating a ticket in a service management system or even triggering an automation runbook. To make the most of this feature, it’s a good idea to create action groups that group together different actions for different types of alerts. For example, you can create an action group for critical alerts that sends an email to the on-call engineer, creates a ticket in your service management system and triggers an automation runbook to perform a specific action.
  4. Test your alerts: Before you start using your alerts in production, it’s a good idea to test them to make sure that they are configured correctly. You can do this by manually triggering the alert and verifying that the correct actions are taken. For example, you can test your alert by temporarily setting the threshold to a lower value and then verifying that the alert is triggered and the correct action is taken.
  5. Monitor your alerts: Once your alerts are set up, it’s important to keep an eye on them to make sure that they are working as expected. You can do this by monitoring the alert history in the Azure portal, which shows you a record of all alerts that have been triggered and the actions that were taken in response. This will help you to identify any potential issues with your alerts and make any necessary adjustments.

By following these best practices, you can ensure that your Azure Monitor alerts are configured correctly and that they will help you quickly identify and resolve any issues with your Azure resources. By being specific, using alert suppression, action groups, testing the alerts and monitoring them you can make the most out of Azure Monitor alerts and have a more reliable monitoring system.

Note: There are some great example of how to create alerts using JSON templates available here.

Loading

Uncovering Anomalies in Time-series Data with Kusto Query Language (KQL)

Anomaly detection is a crucial task in monitoring the performance of various systems. In this blog post, we will discuss how to use Kusto Query Language (KQL) to detect anomalies in CPU performance data.

Spikes

One of the most common types of anomalies is spikes in the data. Spikes occur when the data deviates significantly from its normal behavior. To detect spikes in CPU usage over time, we can use the following KQL query:

let window = 24h;
Perf
| where ObjectName == "Processor" and CounterName == "% Processor Time"
| where TimeGenerated > ago(window)
| summarize avg(CounterValue),stdev(CounterValue) by bin(TimeGenerated, 2h), Computer
| where (avg_CounterValue - avg_CounterValue) > 3 * stdev_CounterValue

This query first filters the data to include only CPU usage data and only the data that is within the last 24 hours. It then groups the data by time window and computer, calculates the average and standard deviation of the data, and finally filters out any data points that are more than 3 standard deviations away from the average.

Outliers

Another type of anomaly is outliers. Outliers are data points that are significantly different from the rest of the data. To detect outliers in CPU usage across different machines, we can use the following KQL query:

Perf
| where ObjectName == "Processor" and CounterName == "% Processor Time"
| summarize percentile(CounterValue,75) by Computer
| where percentile_CounterValue_75 > 50

This query filters the data to include only CPU usage data, calculates the 75th percentile of the data for each computer, then filters the results and only show the computers that have 75th percentile values higher than 50.

Changes over time

Finally, another type of anomaly is changes in the data over time. To detect changes in CPU usage over time, we can use the following KQL query:

let window = 7d;
Perf
| where ObjectName == "Processor" and CounterName == "% Processor Time"
| where TimeGenerated > ago(window)
| summarize avg(CounterValue) by Computer, TimeGenerated = startofday(TimeGenerated)
| join (
    Perf
    | where ObjectName == "Processor" and CounterName == "% Processor Time"
    | where TimeGenerated > ago(window)
    | summarize arg_min(TimeGenerated, CounterValue) by Computer, TimeGenerated = startofday(TimeGenerated)
    | where TimeGenerated < TimeGenerated
    | project Computer, TimeGenerated, CounterValue
) on Computer, TimeGenerated
| extend diff = avg_CounterValue - CounterValue
| where abs(diff) > 10

This query filters the data to include only CPU usage data and only the data that is within the last 7 days. It then groups the data by day and computer, calculates the average of the data, and finds the difference between consecutive days’ averages. The query finally filters out any data points where the difference is greater than 10.

Summary

In this blog post, we have discussed how to use KQL to detect different types of anomalies in CPU performance data. These queries can be customized and adjusted to fit the specific needs of your system and can be a valuable tool in monitoring and maintaining the performance of your systems. Anomaly detection can be complex but is also very powerful.

Loading

Kusto Detective Agency: Challenge 5 – Big heist

Challenges

The ADX team upped their game once again. Time for a proper forensic investigation, track down the baddies, find clues and decipher their meaning all while racing against the clock. Can you come up with the date and location of the heist in time to stop them?

General advice

This challenge requires a bit of creative thinking, even with the hints there are multiple paths to go down and not all of them are going to lead to the right outcome. the key to this one, keep it simple and logical.

Challenge 5: Big heist

This challenge also has multiple parts, first we need to identify four chatroom users from over three million records and then we need to “hack” their IPs to get more clues.

Query Hint Part 1

Trying to identify the right user behaviors here is super tricky, I got tripped up here by adding a level of complexity that was unnecessary. At its simplest we would have to find a room where only 4 people joined and no one else. Some KQL commands that will be useful here are tostring, split, extend, row_cumsum

Big heist challenge text - Part 1

Hello. It’s going to happen soon: a big heist. You can stop it if you are quick enough. Find the exact place and time it’s going to happen.
Do it right, and you will be rewarded, do it wrong, and you will miss your chance.

Here are some pieces of the information:
The heist team has 4 members. They are very careful, hide well with minimal interaction with the external world. Yet, they use public chat-server for their syncs. The data below was captured from the chat-server: it doesn’t include messages, but still it may be useful. See what you can do to find the IPs the gang uses to communicate.
Once you have their IPs, use my small utility to sneak into their machine’s and find more hints:
https://sneakinto.z13.web.core.windows.net/<ip>

Cheers
El Puente

PS:
Feeling uncomfortable and wondering about an elephant in the room: why would I help you?
Nothing escapes you, ha?
Let’s put it this way: we live in a circus full of competition. I can use some of your help, and nothing breaks if you use mine… You see, everything is about symbiosis.
Anyway, what do you have to lose? Look on an illustrated past, fast forward N days and realize the future is here.

Query challenge 5 - Part 1

let rooms =
ChatLogs
| where Message contains “joined”
| extend user = tostring(split(Message,” “,1))
| extend chan = tostring(split(Message,” “,5))
| distinct user, chan
| summarize count() by chan
| where count_ == 4
| project chan;
let chatroom =
ChatLogs
| extend action = tostring(split(Message,” “,2))
| where action contains “joined” or action contains “left”
| extend A1 = iif(action contains “joined”, 1, -1)
| extend user = tostring(split(Message,” “,1))
| extend chan = tostring(split(Message,” “,5))
| where chan in (rooms)
| order by Timestamp asc
| extend total=row_cumsum(A1, chan != prev(chan))
| where total ==4
| distinct chan;
let users =
ChatLogs
| extend chan = tostring(split(Message,” “,5))
| where chan in (chatroom)
| extend user = tostring(split(Message,” “,1))
| distinct user;
ChatLogs
| extend user = tostring(split(Message,” “,1))
| where user in (users)
| where Message contains “logged”
| extend IP = tostring(split(Message,” “,5))
| distinct IP

Alright we’ve got some IPs, so time to “hack”, using the provided tool you’ll gather a set of clues from each of the gang members, there are a few key things you need to find, these are an email, some pictures, a cypher tool, an article and a pdf copy of it and of course a video from the nefarious professor Smoke.

From here on out it’s all investigative skills, you now have everything you need to find the date and location of the heist and save that datacenter!

Final hint

In order to decrypt the secret message, you’re going to need a special key, the format looks familar right? Spot on you’ll need the answer from challenge 4!

Congratulations Detective!

If you’ve found this blog series useful, please let me know via LinkedIn or drop a comment below. These challenges have been super fun and I for one am looking forward to season 2!

Loading

Kusto Detective Agency: Challenge 4 – Ready to play?

Challenges

Just when you thought these challenges couldn’t get any cooler along comes your very own nemesis and a multi-part puzzle taking you on a street tour of New York City.

General advice

First, we need to import the data ourselves this time around, using Ingest from Blob under our data blade, you can also change the column name I used “Primes”
Calculating the prime numbers can be a little tricky as our free ADX cluster requires us to be clever with our query in order to allow it to complete, luckily, we get a free lesson on “special primes”

Challenge 4: Ready to play?

This challenge has two parts and we’ll look at them in turn, first we need to identify a specific prime number and then use that to get the second clue and then we have to find a specific area in New York City,

Query Hint Part 1
Calculating the largest special prime under 100M can be done in a variety of ways, the trick is working within the limited capacity of our free ADX cluster. KQL commands that are useful are serialize, prev, next and join
Ready to play? challenge text - Part 1


Hello. I have been watching you, and I am pretty impressed with your abilities of hacking and cracking little crimes.
Want to play big? Here is a prime puzzle for you. Find what it means and prove yourself worthy.

20INznpGzmkmK2NlZ0JILtO4OoYhOoYUB0OrOoTl5mJ3KgXrB0[8LTSSXUYhzUY8vmkyKUYevUYrDgYNK07yaf7soC3kKgMlOtHkLt[kZEclBtkyOoYwvtJGK2YevUY[v65iLtkeLEOhvtNlBtpizoY[v65yLdOkLEOhvtNlDn5lB07lOtJIDmllzmJ4vf7soCpiLdYIK0[eK27soleqO6keDpYp2CeH5d\F\fN6aQT6aQL[aQcUaQc[aQ57aQ5[aQDG

Start by grabbing Prime Numbers from
https://kustodetectiveagency.blob.core.windows.net/prime-numbers/prime-numbers.csv.gz and educate yourself on Special Prime numbers (https://www.geeksforgeeks.org/special-prime-numbers), this should get you to
https://aka.ms/{Largest special prime under 100M}

Once you get this done – you will get the next hint.

Cheers,
El Puente.

Query challenge 4 - Part 1

//Method 1 – This query will calculate the largest prime under 100M using the Sieve of Eratosthenes method to test each prime

Challenge4
| serialize
| order by Primes asc
| extend prevA = prev(Primes,1)
| extend NextA = next(prevA,1)
| extend test =  prevA + NextA + 1
| where test % 2 != 0 // skip even numbers
| extend divider = range(3, test/2, 2) // divider candidates
| mv-apply divider to typeof(long) on
(
  summarize Dividers=countif(test % divider == 0) // count dividers
)
| where Dividers == 0 // prime numbers don’t have dividers
| where test < 100000000 and test > 99999000
| top 1 by test

//Method 2 – This query will calculate the largest prime under 100M by comparing special primes to the data set of all prime numbers

Challenge4
| serialize
| project specialPrime = prev(Primes) + Primes + 1
| join kind=inner (Challenge4) on $left.specialPrime == $right.Primes
| where specialPrime < 100000000
| top 1 by Primes desc


Now that we have our prime number we can move on to part 2
Largest special prime under 100m

The number we want is 99999517 so we can now head over to http://aka.ms/99999517

A-ha a message from our nemesis and we need to meet them in a specific area marked by certain types of trees!

Ready to play? challenge text - Part 2

Well done, my friend.
It's time to meet. Let's go for a virtual sTREEt tour...
Across the Big Apple city, there is a special place with Turkish Hazelnut and four Schubert Chokecherries within 66-meters radius area.
Go 'out' and look for me there, near the smallest American Linden tree (within the same area).
Find me and the bottom line: my key message to you.

Cheers,
El Puente.

PS: You know what to do with the following:

----------------------------------------------------------------------------------------------

.execute database script <|
// The data below is from https://data.cityofnewyork.us/Environment/2015-Street-Tree-Census-Tree-Data/uvpi-gqnh 
// The size of the tree can be derived using 'tree_dbh' (tree diameter) column.
.create-merge table nyc_trees 
       (tree_id:int, block_id:int, created_at:datetime, tree_dbh:int, stump_diam:int, 
curb_loc:string, status:string, health:string, spc_latin:string, spc_common:string, steward:string,
guards:string, sidewalk:string, user_type:string, problems:string, root_stone:string, root_grate:string,
root_other:string, trunk_wire:string, trnk_light:string, trnk_other:string, brch_light:string, brch_shoe:string,
brch_other:string, address:string, postcode:int, zip_city:string, community_board:int, borocode:int, borough:string,
cncldist:int, st_assem:int, st_senate:int, nta:string, nta_name:string, boro_ct:string, ['state']:string,
latitude:real, longitude:real, x_sp:real, y_sp:real, council_district:int, census_tract:int, ['bin']:int, bbl:long)
with (docstring = "2015 NYC Tree Census")
.ingest async into table nyc_trees ('https://kustodetectiveagency.blob.core.windows.net/el-puente/1.csv.gz')
.ingest async into table nyc_trees ('https://kustodetectiveagency.blob.core.windows.net/el-puente/2.csv.gz')
.ingest async into table nyc_trees ('https://kustodetectiveagency.blob.core.windows.net/el-puente/3.csv.gz')
// Get a virtual tour link with Latitude/Longitude coordinates
.create-or-alter function with (docstring = "Virtual tour starts here", skipvalidation = "true") VirtualTourLink(lat:real, lon:real) { 
	print Link=strcat('https://www.google.com/maps/@', lat, ',', lon, ',4a,75y,32.0h,79.0t/data=!3m7!1e1!3m5!1s-1P!2e0!5s20191101T000000!7i16384!8i8192')
}
// Decrypt message helper function. Usage: print Message=Decrypt(message, key)
.create-or-alter function with 
  (docstring = "Use this function to decrypt messages")
  Decrypt(_message:string, _key:string) { 
    let S = (_key:string) {let r = array_concat(range(48, 57, 1), range(65, 92, 1), range(97, 122, 1)); 
    toscalar(print l=r, key=to_utf8(hash_sha256(_key)) | mv-expand l to typeof(int), key to typeof(int) | order by key asc | summarize make_string(make_list(l)))};
    let cypher1 = S(tolower(_key)); let cypher2 = S(toupper(_key)); coalesce(base64_decode_tostring(translate(cypher1, cypher2, _message)), "Failure: wrong key")
}

Using the census data, we now need to figure out the location in the clue, luckily, it’s only a KQL query away

Query Hint - Part 2
Getting the right size area can be tricky, a KQL command that will be extremely helpful will be geo_point_to_h3cell

Query challenge 4 - Part 2

//This query will filter a specific size area until it makes the set of trees given in the clue

let locations =
nyc_trees
| extend h3cell = geo_point_to_h3cell(longitude, latitude, 10)
| where spc_common == “‘Schubert’ chokecherry”
| summarize count() by h3cell, spc_common
| where count_ == 4
| summarize mylist = make_list(h3cell);
let final =
nyc_trees
| extend h3cell = geo_point_to_h3cell(longitude, latitude, 10)
| where h3cell in (locations)
|where spc_common ==  “Turkish hazelnut” or spc_common == “American linden”
| summarize count() by h3cell, spc_common
| where spc_common == “Turkish hazelnut” and count_ ==1
| project h3cell;
nyc_trees
| extend h3cell = geo_point_to_h3cell(longitude, latitude, 10)
| where h3cell in (final)
| where spc_common == “American linden”
| top 1 by tree_dbh asc
| project latitude, longitude
| extend TourLink = strcat(‘https://www.google.com/maps/@’, latitude, ‘,’, longitude, ‘,4a,75y,32.0h,79.0t/data=!3m7!1e1!3m5!1s-1P!2e0!5s20191101T000000!7i16384!8i8192’)


Now that we have a location, we’re not done yet and here’s where the fun really starts, using our generated link will take us on a “Tour of the City” and give us a google maps street view link. Have a look around for our mysterious “El Puente” you may need to walk around a little bit.

Now that we’ve found the message, there’s one more thing we need to do and that’s to use the decrypt function to figure out the message from out detective portal, this part was a little tricky and took a few tries to get the right string to use.

Decryption Key

Using the mural the phrase we are looking for is “ASHES to ASHES”

There we have it, another secret message! Keep a hold of this answer as you’ll need it to complete the final challenge.

Well done Detective, we’ve been on quite the journey. See you in the next challenge!


Loading

Kusto Detective Agency: Challenge 3 – Bank robbery!

Challenges

I must admit that the difficulty spike on the challenges is both refreshing and surprising. The level of care that went into crafting each of these scenarios is outstanding and the ADX team have certainly outdone themselves, if you like these cases as much as I do you can let the team know at kustodetectives@microsoft.com

General advice

Again, this case requires some pretty heavy assumptions to solve, some of which the hints will give you clarity on. It’s very easy when trying to solve the bank robbery to end up with a very overcomplicated solution that may take you in the wrong direction, try keep this one simple.

Challenge 3: Bank robbery!

For this challenge you need to track down the hideout of a trio of bank robbers, it seems simple, you have the address of the bank and are provided with all the traffic data for the area now it’s just a case of figuring out where the robbers drove off to.

Query Hint
The trick with this challenge is you need to be able to create a set of vehicles that weren’t moving during the robbery, of course the catch is that only moving vehicles have records in the traffic data. KQL commands that will be useful for this challenge are join, remember that there are different kinds of joins and arg_max

Bonus cool tip

Thanks to my colleague Rogerio Barros for showing me this one because it is awesome! Due to the nature of the traffic data, it is actually possible to plot the route of any number of cars using | render scatterchart. Below is a visual representation of three random cars as they move about Digitown, this is quite interesting once you have identified the three suspects.

Bank robbery challenge text

We have a situation, rookie.
As you may have heard from the news, there was a bank robbery earlier today.
In short: the good old downtown bank located at 157th Ave / 148th Street has been robbed.
The police were too late to arrive and missed the gang, and now they have turned to us to help locating the gang.
No doubt the service we provided to the mayor Mrs. Gaia Budskott in past – helped landing this case on our table now.

Here is a precise order of events:

  • 08:17AM: A gang of three armed men enter a bank located at 157th Ave / 148th Street and start collecting the money from the clerks.
  • 08:31AM: After collecting a decent loot (est. 1,000,000$ in cash), they pack up and get out.
  • 08:40AM: Police arrives at the crime scene, just to find out that it is too late, and the gang is not near the bank. The city is sealed – all vehicles are checked, robbers can’t escape. Witnesses tell about a group of three men splitting into three different cars and driving away.
  • 11:10AM: After 2.5 hours of unsuccessful attempts to look around, the police decide to turn to us, so we can help in finding where the gang is hiding.

Police gave us a data set of cameras recordings of all vehicles and their movements from 08:00AM till 11:00AM. Find it below.

Let’s cut to the chase. It’s up to you to locate gang’s hiding place!
Don’t let us down!

Query challenge 3

//This query will calculate a set of cars not moving during the robbery, which then started moving after it occurred and track vehicles heading to the same address

let Cars =
Traffic
| where Street == 148 and Ave == 157
| where Timestamp > datetime(2022-10-16T08:31:00Z) and Timestamp < datetime(2022-10-16T08:40:00Z) | join kind=leftanti ( Traffic | where Timestamp >= datetime(2022-10-16T08:17:00Z) and Timestamp <= datetime(2022-10-16T08:31:00Z)
) on VIN
| summarize mylist = make_list(VIN);
Traffic
| where VIN in (Cars)
| summarize arg_max(Timestamp, *) by VIN
| summarize count(VIN) by Street, Ave
| where count_VIN == 3


Now just wait for the police to swoop in and recovery the stolen cash, another job well done detective!

Loading

Kusto Detective Agency: Challenge 2 – Election fraud in Digitown!

Challenges

These challenges are a fantastic hackathon approach to learning KQL, every week poses a new and unique approach to different KQL commands and as the weeks progress, I’ve learned some interesting tricks. Let’s take a look at challenge 2.

General advice

I’ve mentioned previously that there are hints that can be accessed from the detective UI, from this challenge onwards the hints provide critical information and without them there are assumptions you need to make, which if incorrect will throw you off the correct solution.

This is also the first challenge that has multiple mays to get to the answer, in this post i will be discussing the more interesting one.

Challenge 2: Election fraud?

The second challenge ramps up the difficulty, you’ve been asked to verify the results of the recent election for the town mascot.

Query Hint
In order to solve challenge, you need to be figure out if any of the votes are invalid and if any are, removed them from the results.
KQL commands that will be helpful are anomaly detection, particularly series_decompose_anomalies and bin, alternatively you can also make use of format_datetime and a little bit of guesswork
Election Fraud challenge text

Query challenge 2

//This query will analyze the votes for the problem candidate and look for anomalies, if any are found they will be removed from the final count give the correct results for the election!

let compromisedProxies = Votes
| where vote == “Poppy”
| summarize Count = count() by bin(Timestamp, 1h), via_ip
| summarize votesPoppy = make_list(Count), Timestamp = make_list(Timestamp) by via_ip
| extend outliers = series_decompose_anomalies(votesPoppy)
| mv-expand Timestamp, votesPoppy, outliers
| where outliers == 1
| distinct via_ip;
Votes
| where not(via_ip in (compromisedProxies) and vote == “Poppy”)
| summarize Count=count() by vote
| as hint.materialized=true T
| extend Total = toscalar(T | summarize sum(Count))
| project vote, Percentage = round(Count*100.0 / Total, 1), Count
| order by Count


Digitown can sleep easy knowing that they have their correct town mascot due to your efforts! Stay tuned for some excitement in challenge 3.

Loading